Introduction
Global warming due to anthropogenic forcing including an increase of greenhouse gas emissions is widely accepted [1]. Local warming, however, is somewhat different than overall global climate change. In particular, the Arctic warming is much more radical than that in other locations [2–4]. Recently, a great attention has been placed on the role of the accelerating decline of Arctic sea ice. The Arctic has its various feedback processes in response to anthropogenic forcing, which have amplified the warming there [5–7]. On the other hands, the decline of multi-year sea ice causes an increase in sea ice variance which can be verified by a simple model [8], which in turn, impacts the weather and climate in high- and mid-latitudes by modulating atmospheric circulation [5,9,10]. A frequent and persistent cold surge in Eurasia and North America resulted from Arctic Amplification aided by recent sea ice loss [3,11]. In addition, a negative North Atlantic Oscillation-like atmospheric response to sea ice loss via reduced baroclinicity over the Barents and Kara Seas resulted in a warm Arctic and cold continent temperature pattern [3,12,13].
In addition, the change in atmospheric circulation associated with the Arctic sea ice decline has potential to influence on climate variability in ocean. There are several studies that showed how Arctic sea ice decline impact on climate variability in Atlantic Ocean [14]. However, there are few studies investigating how the melting of sea ice in the Arctic influences climate variability in the North Pacific Ocean, which is examined in this study. We suggest that the loss of sea ice in the Arctic influences the persistence and periodicity of the Pacific Decadal Oscillation (PDO) based on an examination of the observations and coupled general circulation model (CGCM) experiments. The PDO is the most dominant mode of sea surface temperature (SST) variability in the North Pacific on the low-frequency timescales [15–17], which is defined as the leading empirical orthogonal function mode of SST in the North Pacific north of 20°N [18]. The changes in PDO properties including its persistency and periodicity may influence coupled ocean-atmosphere processes accompanied with atmospheric circulations in the North Pacific, resulting in the changes in regional temperature and precipitation around the rim of the Pacific Ocean [19–25]. Furthermore, a change in PDO’s persistency can affect the duration of PDO’s positive and negative phase, which is associated with the variations of global mean surface temperature such as a warming hiatus [26]. Therefore, it is important to examine connections between sea ice loss in the Arctic and PDO to understand the influence of sea ice loss on regional and global climate variability.
The remainder of the paper is as follows. The Methods section describes the definition of indices used in this study and the design of model experiments. The Result section presents findings from the reanalysis dataset and the experiment outputs. Finally, the Discussion section provides an overview of the key results and their implications.
Methods
We analyze the monthly SST, sea level pressure (SLP), and ocean temperature obtained from Extended Reconstruction SST version 3 (ERSSTv3b) [27], and the National Centers for Environmental Prediction/National Center for Atmospheric Research (NCEP-NCAR) reanalysis 1 [28], respectively. Sea ice concentration (SIC) and surface air temperature at 2 m is obtained from interim data of ECMWF (ERA-Interim) [29] which is available since 1979. The PDO monthly index, which is defined as the first empirical orthogonal function mode of SST anomalies in the North Pacific [18], was obtained from the University of Washington (http://jisao.washington.edu/pdo/PDO.latest). We mainly analyze the PDO index since 1979 to meet the variability of SIC, otherwise we described a specific analyzed period. On the other hand, the Aleutian low (AL) associated with the standardized PDO index, which is referred to as AL_PDO index, is obtained from a linear regression coefficient of the SLP onto the standardized PDO index with 15-year windows.
In this study, anomalies are defined as departures from the monthly climatological mean calculated over the entire analysis period (1979–2017). For detrending purpose, we removed the linear trend at each grid point for every regression analysis window to eliminate the influence of long-term climate change signals on our analysis of PDO variability.
We conduct two experiments using the Geophysical Fluid Dynamics Laboratory Climate Model version 2.1 (CM2.1), which is a full-coupled climate model, to examine the impact of sea ice loss on the PDO’s persistence. The coupled model is composed of ocean, atmosphere, land and sea ice. Horizontal resolution of the atmosphere and land is 2° latitude and 2.5° longitude with 24 atmospheric levels. And the other components are of 200 latitude×360 longitude tripolar grid with 50 oceanic vertical levels [30]. We use SST restoring technique which enables to control the amount of sea ice in the Arctic. For example, the shorter (longer) restoring relaxation time, the closer to (far from) the observed sea ice extent, which causes to simulate relatively more (less) sea ice in the Arctic. Using this methodology, we conducted two experiment sets, i.e., high (hereafter, referred to as ICE_H run) and low (hereafter, referred to as ICE_L run) concentration of sea ice in the Arctic, by controlling SST restoring relaxation time scale, 5 days and 60 days, respectively. For restoring observed SST, annual cycle data averaged from 1979 to 2008 from NOAA ERSST v3b is used [27].
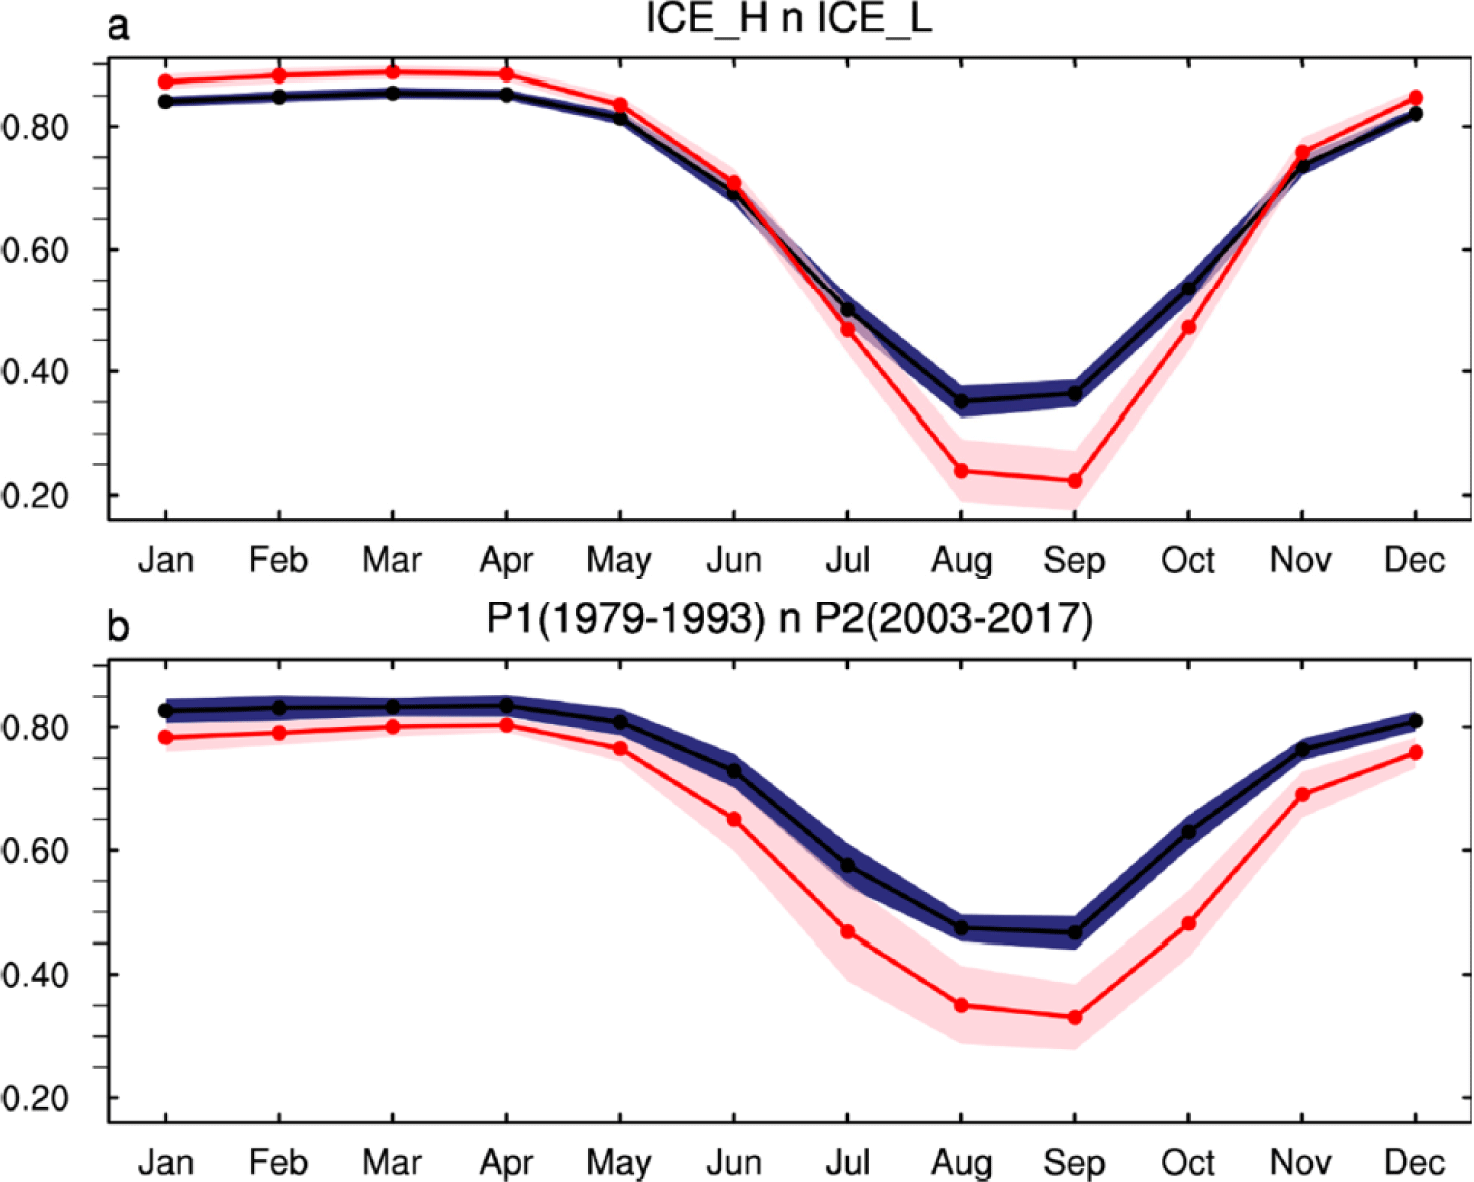
Both the ICE_H and ICE_L runs are identical except for the relaxation time scale, which represent the time at which the simulated SST approaches the climatological (1979–2008) SST in the Arctic, north of 65°N. In other words, the observational climatological SST is restored with different time scales only in the Arctic, elsewhere is fully coupled in atmosphere and ocean in both experiments. In the ICE_H run, therefore, there is little loss of sea ice along with its small variance because of a very short period of relaxation time. In contrast, the ICE_L run tends to simulate the reduction of sea ice along with its enhanced variance compared with that in the ICE_H run (Fig. 1a). To confirm whether the SIC and its variance simulated in two experiments are comparable with the observations, we also analyze ERA-Interim. Fig. 1b is the same as in Fig. 1a except two contrasting periods in the ERA-Interim reanalysis: P1 (1979–1993) and P2 (2003–2017), during which the PDO’s persistence and its dominant periodicity differ (see also Fig. 2). The results in Fig. 1a and b indicate that the ICE_H run corresponds to the period of high SIC and low variance observed in P1, whereas the ICE_L run corresponds to the period of low SIC and high variance observed in P2. In two experiments, the PDO index is defined as the PC time series of the first EOF SST anomalies in the North Pacific north of 20°N, which is the same as in the observation. Note that a long-term simulation period of 200 years is performed in two experiments and the last 150-year simulation dataset is analyzed in the present study. Note that carbon dioxide mixing ratio is held fixed as 1990 in order to exclude impact of other climate variability response due to global warming for both experiments.
Results
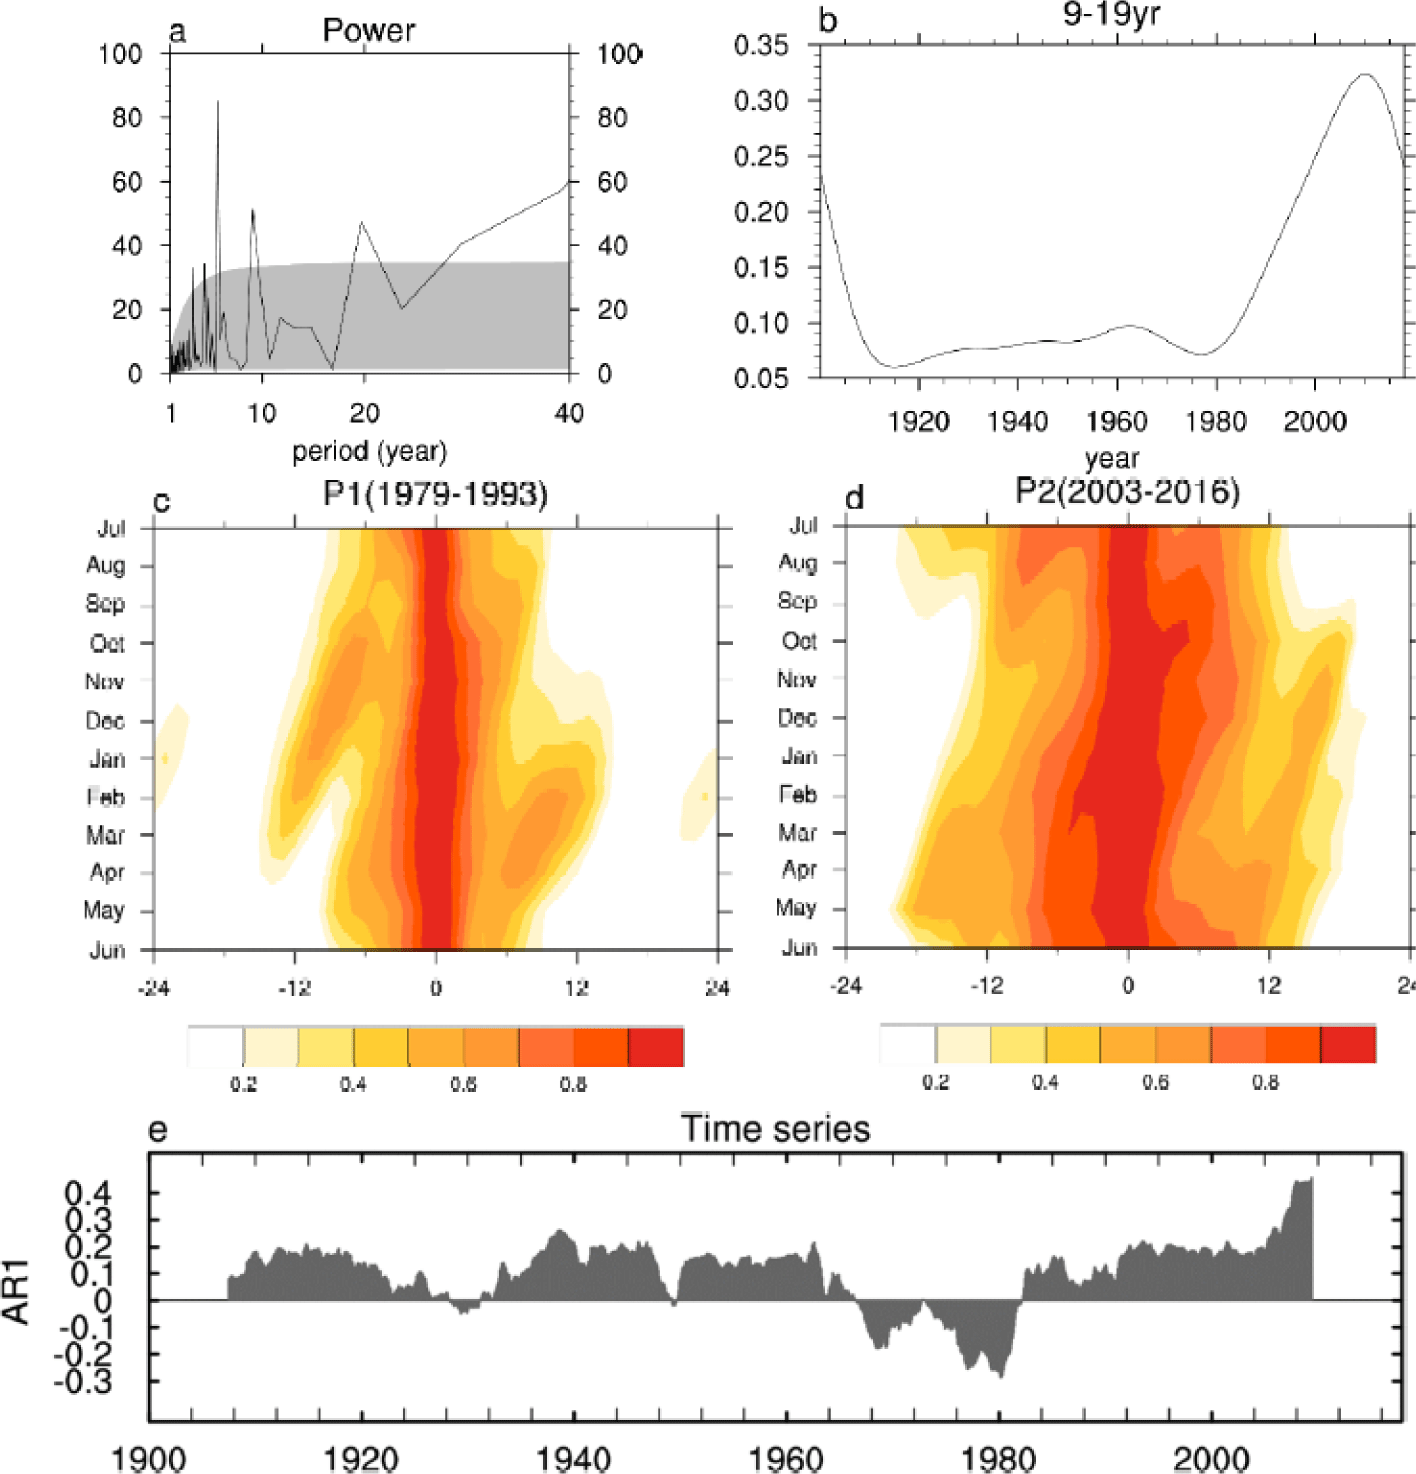
Fig. 2a displays the spectral density of the monthly PDO index in the period 1900–2017. While the PDO is characterized by the variability on interannual-to-multi-decadal timescales, its spectral density is dominant on the low-frequency time scales of 9–19 years since the late-1990s and early 2000s (Fig. 2b). Furthermore, we found that the persistence of the PDO, which can be represented by the autocorrelations of the monthly PDO index, has been lengthened between two contrasting periods, i.e., P1 (1979–1993) and P2 (2003–2017) (Fig. 2c and d). To further examine PDO’s persistency, we calculate the lag 1-year autocorrelation of PDO monthly index for 1900–2017. This correlation represents the first-order autoregressive (AR-1) processes (hereafter, AR-1 coefficient), which is associated with the PDO’s persistency [31,32]. Consistent with the results in Fig. 2c and d, the running mean of AR-1 coefficients with a 15-year window is the highest in the recent past (Fig. 2e). Note that the AR-1 coefficient during P2 is 0.46, which is the highest coefficient compared to any other 15-year window for 1900–2017 and this result little changes based on a 20-year or 25-year window (figure not shown).
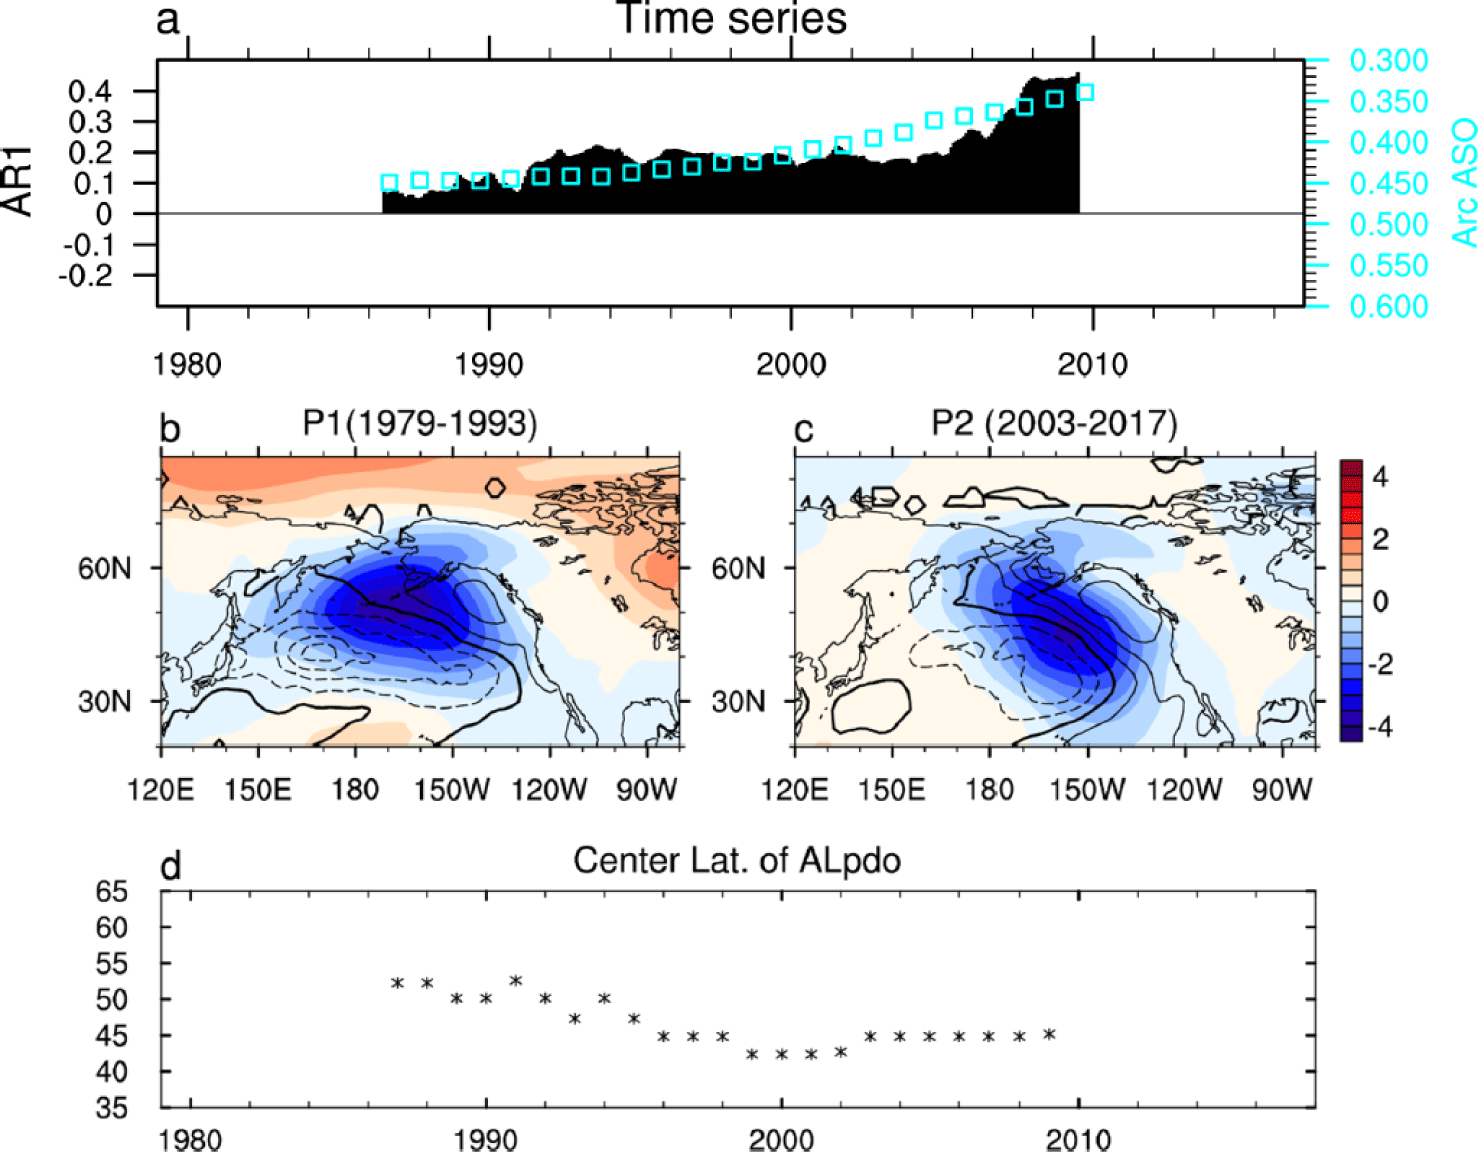
Fig. 2 raises an important question regarding the underlying reason for the unprecedented increase of the PDO’s persistency, as well as the change of its dominant periodicity. To examine this question, we first show that the PDO’s persistence, which is represented by the 15-year running mean AR-1 coefficient, increases along with the reduction of the averaged SIC in the Arctic during August-September-October (hereafter, ASO) for the period of 1979–2017 (Fig. 3a). The ASO season is selected because it is the season when the sea ice extent is at its minimum in the Arctic. Fig. 3a and Fig. 1b indicates that a statistical coherence exists in the reduction of the SIC in the Arctic and the PDO’s persistency as well as the change in the PDO’s periodicity.
In the present study, we mainly focus on the persistence of the PDO, which can be lengthened by two main processes according to the previous studies. One is associated with the strengthening of the PDO-to-AL feedback [33] and the other is associated with ocean dynamical processes including reemergence processes [34]. In particular, we argue that the lengthening of the PDO’s persistence could be associated with the reduction of sea ice in the Arctic, which is associated with the strengthening of the PDO-to-AL feedback. The sea ice reduction in the Arctic is able to thermally force the overlying atmospheric circulation by an enhancement of the surface heat flux [9,35], leading to the formation of anti-cyclonic atmospheric circulation with a barotropic structure in the tropospheric layer [36]. Fig. 4 shows the difference in atmospheric circulation between P1 and P2 during ASO, the season of minimum Arctic sea ice extent. Overall barotropic anti-cyclonic circulation anomalies are occupied in the Arctic.

The anti-cyclonic circulation due to sea ice loss in the Arctic acts to shift the main atmospheric circulation in the North Pacific, i.e., the AL, to the south, which is evidenced in Fig. 3b–d. In particular, it is found that the center of the AL associated with the PDO, i.e., AL_PDO, has recently shifted to the south (Fig. 3d). Yim et al. [33] already showed that the southward shifted AL_ PDO brings stronger westerly and cold SSTA in the western-to-central North Pacific via the southward shift of boundaries of subpolar gyre cell and subtropical cell. Subsequently, this causes the negative SST anomalies due to oceanic advection via Ekman transport in the southern part of western-to-central North Pacific, which is also seen in Fig. 3b and c. The negative SST anomalies lead to strong meridional gradient of SST anomalies, which causes the enhanced atmospheric response in the western-to-central North Pacific. This results in the strengthening of PDO-to-AL feedback, leading to a lengthening of PDO’s persistency. In other words, the dynamic ocean-atmosphere coupling between wind stress and oceanic adjustment is stronger when the center of the AL is shifted to the south [33]. This is because the southward shift of the sea surface height anomalies and wind stress curl anomalies (Fig. 5), which is due to the southward shift of the AL, are crucial for the sensitivity of the oceanic responses to atmospheric forcing [37]. Therefore, the SST anomalies associated with the PDO in the North Pacific (Fig. 3c) may be more strongly related to the ocean dynamic process during P2 compared to that during P1, which is associated with the lengthening of PDO’s persistency.

We argue that an increase in PDO’s persistence is associated with the southward shift of AL_ PDO due to the sea ice loss in the Arctic. To support this notion, two experiments are conducted. As described in the Method section, climatological SST is restored in the Arctic only with different relaxation time scales, 5 days and 60 days, respectively, in the ICE_H and the ICE_L. Outside of the Arctic is fully coupled in atmosphere and ocean in both experiments. Note that the ICE_H run simulates little loss of sea ice along with its small variance because of a very short period of relaxation time, in contrast, the ICE_L run tends to simulate the reduction of sea ice along with its enhanced variance (see Fig. 1a). By comparing with ICE_H and ICE_L run, we are able to examine the impact of sea ice loss in the Arctic on the PDO’s persistence.
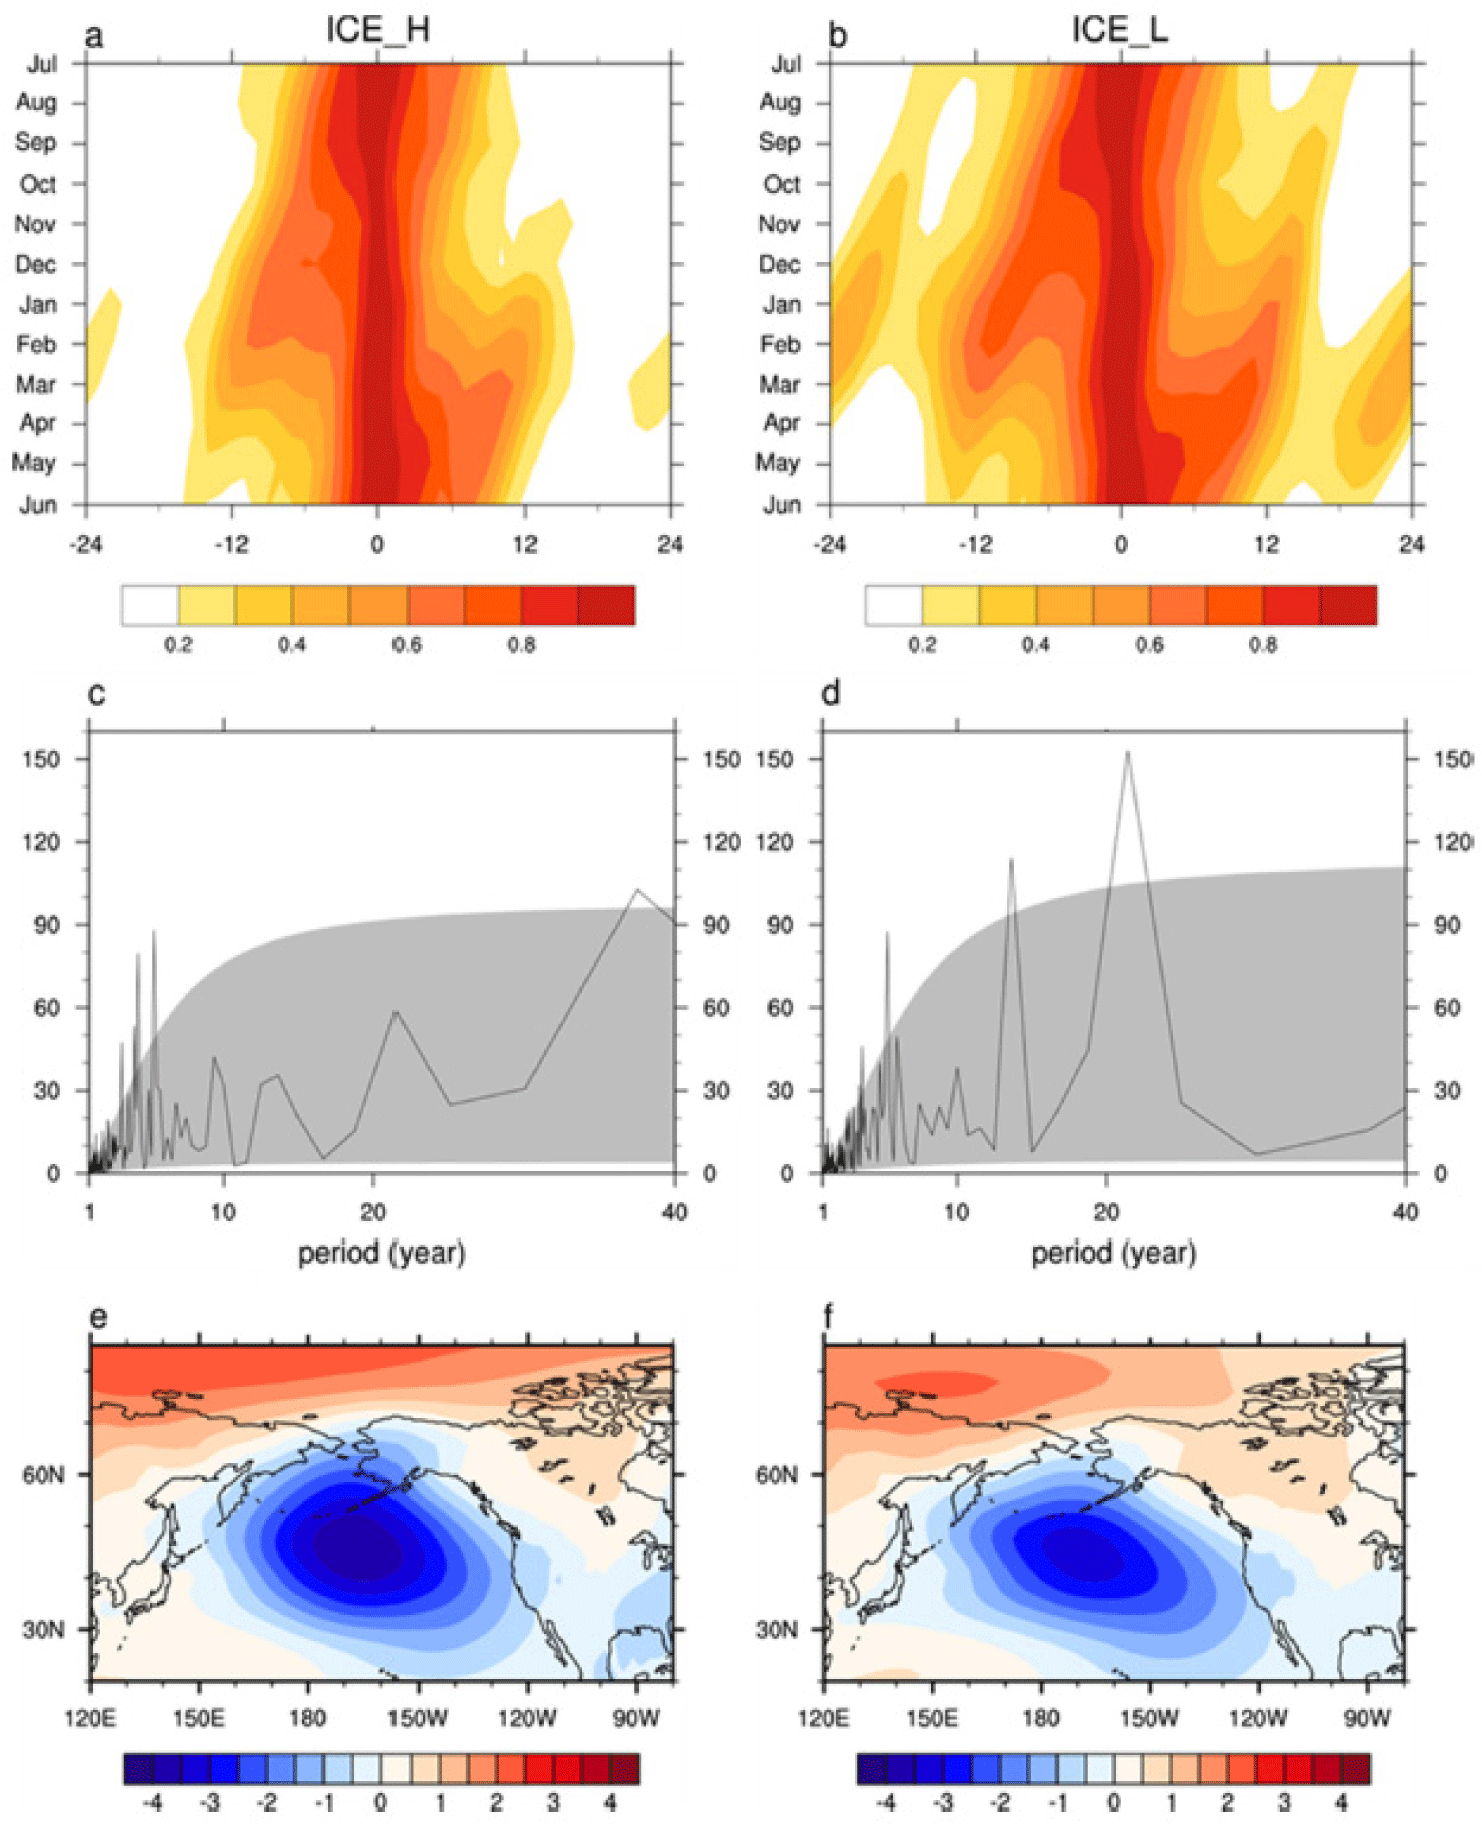
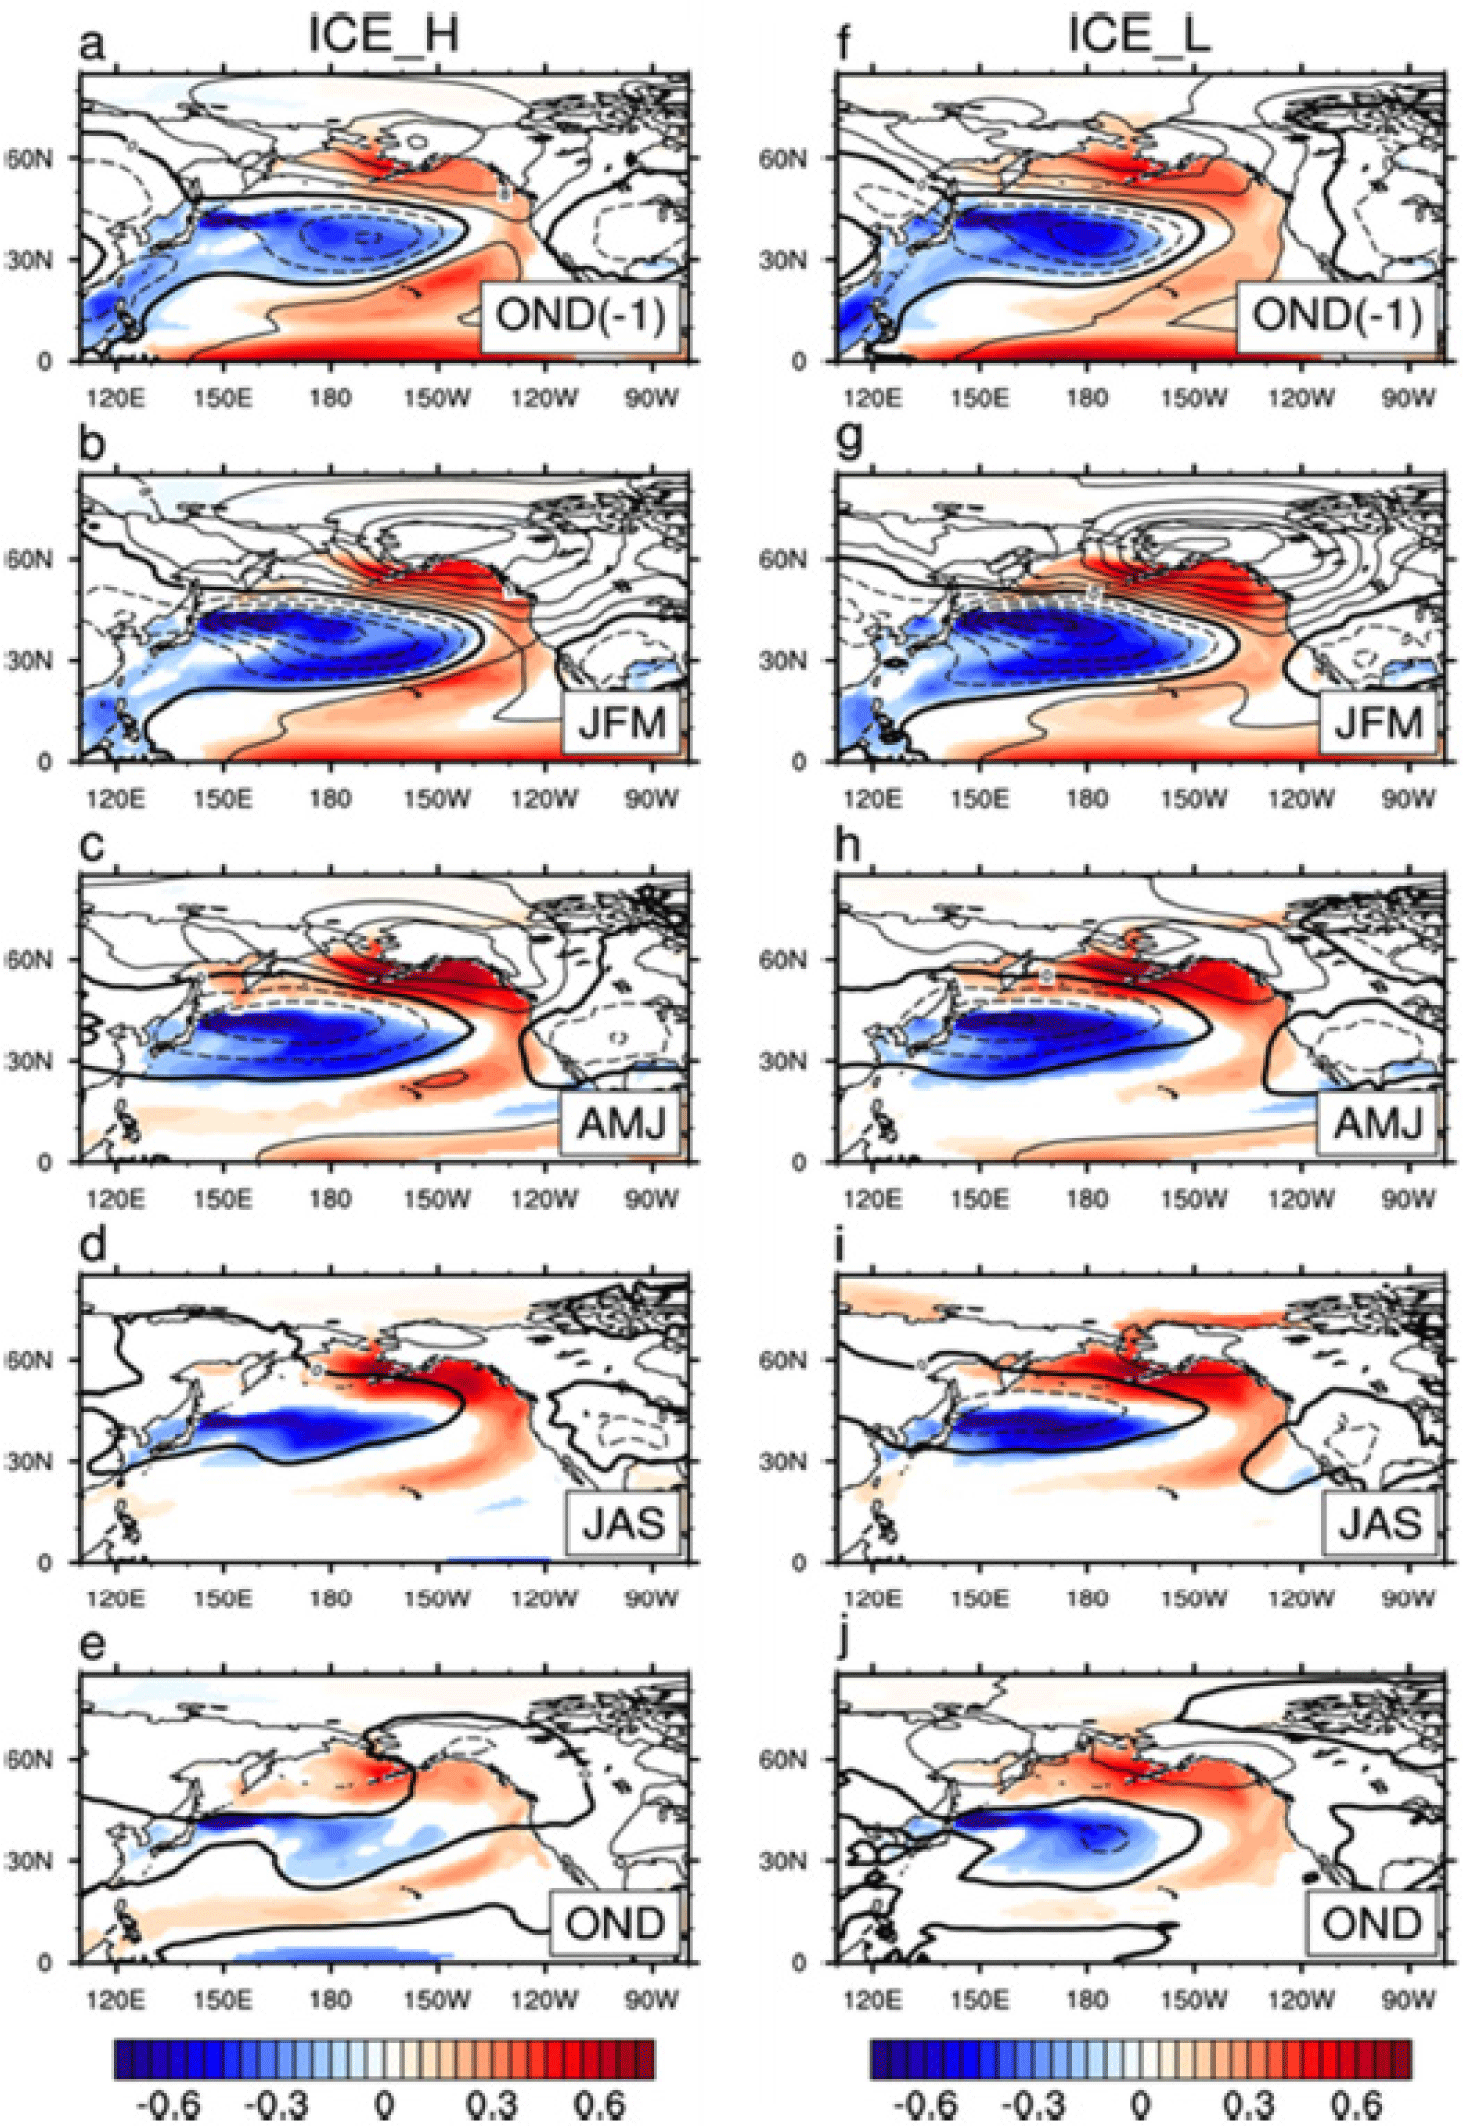
Fig. 6a and b display the autocorrelations of the monthly PDO index simulated in the ICE_H and the ICE_L, respectively. It is found that the PDO’s persistence simulated in the ICE_L run is lengthened in most of all the season compared to that in the ICE_H run (Fig. 5a and b). This is consistent with the observations (Fig. 2c and d), indicating that when the SIC is reduced and its variance is large (i.e., ICE_L and P2), the PDO’s persistency becomes longer than the period when the SIC is high and its variance is small (i.e., ICE_H and P1). In addition, the dominant periodicity of the PDO index simulated in the ICE_L run is much longer than that in the ICE_H run (Fig. 6c and d), which is similar to the observations (see Fig. 2a and b). Similarly, the center of AL_ PDO simulated in the ICE_L run is slightly shifted to the south compared to that in the ICE_H run (Fig. 6e and f), which is also consistent with observations (see Fig. 3b and c). These results support that sea ice loss in the Arctic is associated with the southward shift of AL_PDO in the North Pacific by the formation of anti-cyclonic atmospheric circulation with a barotropic structure in the troposphere layer during ASO (Fig. 4 and Fig. 7). This results in the lengthening of PDO’s persistency. In details, Fig. 8 displays the seasonal evolution of SST anomalies and the atmospheric circulation associated with the PDO during boreal winter and spring (December-January-February-March-April, hereafter, DJFMA) in two runs. It is evident that the AL_ PDO in the western and central North-Pacific persistently acts to cool the PDO-like SST anomalies in the ICE_L run (Fig. 8i and j) compared to that in the ICE_H run (Fig. 8d and e), indicating that the PDO’s persistency is lengthened in the ICE_L run. Note that the spatial pattern of AL-like atmospheric circulation associated with the PDO-like SST anomalies is not observed in ICE_H run since the following summer (July-August-September) and fall (October-November-December) (Fig. 8d and e). These results indicate that the interaction of AL_PDO and the PDO is stronger in the ICE_L run that in the ICE_H run, which is associated with the lengthening of PDO’s persistency. Therefore, we argue that sea ice loss is able to modulate the PDO’s properties including its persistency via the changes in the interactions between atmospheric circulation and ocean in the North Pacific.

Discussion
We have examined the role of the Arctic sea ice loss on the PDO’s persistency and its dominant periodicity. By analyzing the observation, it was found that the PDO’s persistency is lengthened along with the increase of the PDO’s dominant periodicity around 9–19 years. We proposed a possible linkage between Arctic sea ice reduction and a lengthening of PDO’s persistence. We argued that the sea ice reduction in the Arctic thermally forces the overlying atmospheric circulation, which acts to shift the AL to the south. This may cause the strengthening of the PDO-to-AL feedback in the North Pacific, which leads to the lengthening of PDO’s persistency.
To test this hypothesis, we compared with two CGCM simulations, i.e., ICE_L with a low Arctic SIC and its small variance and ICE_H with a high Arctic SIC and its large variance. It was found that ICE_L tends to simulate a lengthening of PDO’s persistency compared to the ICE_H, which is consistent with the observations. Furthermore, the dominant periodicity of the PDO index simulated in the ICE_L run is much longer than that in the ICE_H run. These were supported by the temporal evolution of spatial pattern of SST anomalies and atmospheric circulation associated with the PDO, which persists longer in the ICE_L than that in the ICE_H.
Our results implied that sea-ice loss in the Arctic, which is mostly due to anthropogenic forcing, is able to influence the PDO persistence with its dominant periodicity. It is known that the PDO plays an important role on Earth’s climate, in particular, on the variation of global surface temperature [26,38]. For example, the moderate increase in global surface temperature in the late 1990s and the early 2010s, which is associated with a negative phase of PDO [26], is in contrast of a sharp increasing of global surface temperature since the mid-2010s along with switching to a positive phase of PDO. Therefore, the change in the PDO persistence and its periodicity due to amplified Arctic warming involving sea ice loss along with global warming, may feed back to the variation of global surface temperature variation.
While our ICE_H and ICE_L experiments isolate the effects of Arctic sea ice variability, they do not account for greenhouse gas–driven mean-state changes or changes in the coupling of internal climate modes such as PDO and the North Pacific Gyre Oscillation (NPGO). The NPGO is climate pattern that describes decade-to-decade changes in ocean conditions in the North Pacific [39,40]. Recent decades have seen North Pacific SST warming and enhanced meridional SST gradients, as well as strengthened PDO–NPGO interactions [40,41], all of which may contribute to the observed southward shift of the AL. These processes are absent in our fixed-CO2 experiments and likely help explain the discrepancy between observed and simulated AL_PDO shifts. Future studies should incorporate transient GHG forcing and internal variability coupling to better disentangle the drivers of PDO and AL_PDO changes.

