
Introduction
The magnitude of urban expansion has been rapid since 1800 [1]. Projections suggest that about 68% of the global population is expected to live in urban areas by 2050, concentrated in a few countries only, and India alone will add 416 million urban people [2]. Although, urban areas are considered as the engines of economic growth and development, the residents of cities do not necessarily get the possible benefit of urbanization and often lack access to basic services such as drinking water, sanitation, electricity, waste collection, transportation, education, healthcare, and emergency services [3,4]. Moreover, the population growth, underdevelopment, and poverty become the primary reasons behind increase in informal settlements in cities [4], that eventually turn into hotspots of vulnerabilities [5,6], leading to risk accumulation and potential disasters.
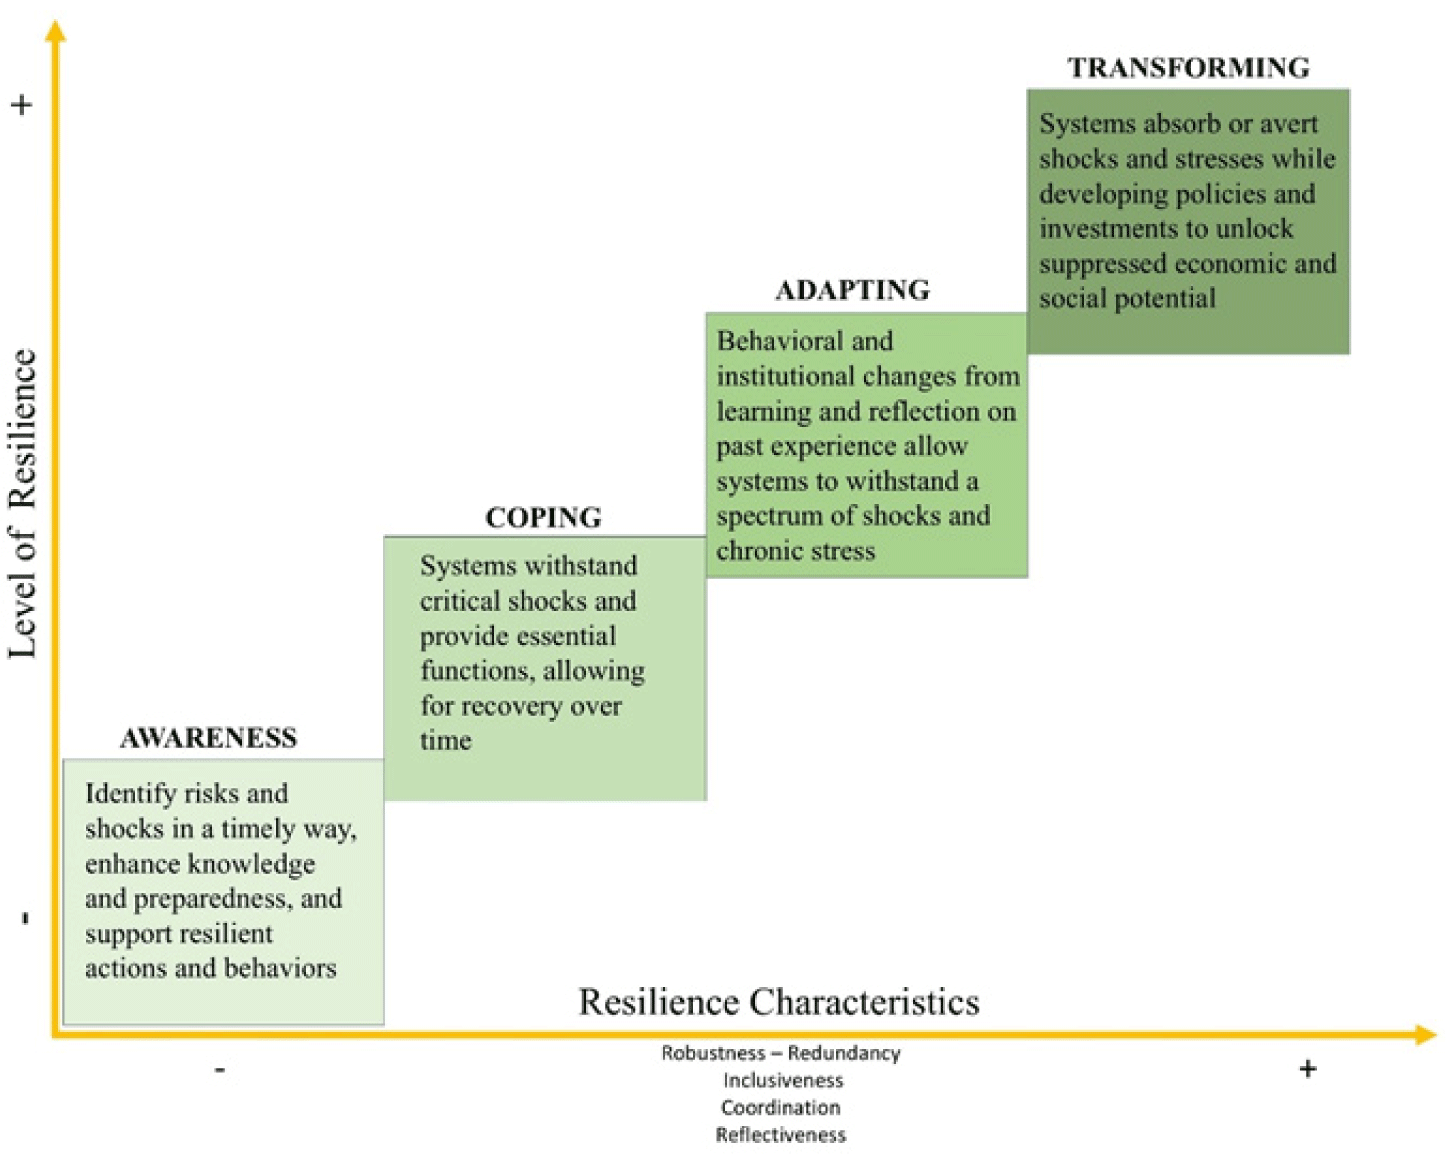
In order to deal with the challenges of rapid urban expansion, inclusion of disaster resilience into development process through public and private partnership must be a priority [7]. Building resilience has also become a key link to achieve sustainable development [8]. Theoretically, resilience is defined as “ability of a system, community or society exposed to hazards to resist, absorb, accommodate, adapt to, transform and recover from the effects of a hazard in a timely and efficient manner, including through the preservation and restoration of its essential basic structures and functions through risk management” [9]. The concept of disaster resilience illustrates community’s “degree of preparedness” and “capacity to recover” [10]. Building resilience is an effective and sustainable way of saving lives, protecting assets and environment than providing disaster aid [11]. The analytical framework of ‘resilience strengthening’ has three main capacity components i.e., absorptive, adaptive, and transformative [10].
Disaster resilience assessment is a domain between theoretical and applied facet of resilience which is being used as a decision support tool for societies to live in changing and uncertain environments [12]. It identifies potential failure pathways and thresholds, and works as input to develop response strategies for recovery system structure and function [13,14]. This process usually starts with identification of likely shocks both natural and anthropogenic to which a city, system or part of it is exposed. Resilience assessment answers three fundamental questions: “1. resilience for whom? 2. resilience of what? and 3. resilience to what?”, identifying sensitive systems or system components, and shocks or stresses at different spatial scales [15].
Rapid population growth, economic development, and urbanization have significantly increased the exposure and vulnerability of people and infrastructure to a range of hazards [16], necessitating the need for comprehensive risk and resilience assessments. Conceptually, there is no clear distinction between risk and resilience; however, resilience assessment cannot be properly conducted, without considering risk [17]. While risk management takes a component-level approach, resilience management adopts a broader, system-oriented viewpoint [18]. An integrated risk and resilience assessment shifts towards a solution-oriented assessment approach [19]. Assessing resilience is inherently complex, as is it unclear which events to include and it also requires accounting for unforeseen and unpredictable disruptions [20]. Resilience assessment beyond theoretical frameworks remains underdeveloped, often causing uncertainty among researchers and practitioners and failing to resonate with policymakers [21]. Participatory approaches offer an opportunity to assess resilience of a system; however, not all participatory assessments deliver expected results. For example, traditional participatory approaches that focus primarily on raising disaster risk awareness tend to position communities as passive recipients of information instead of active contributors; as a result, fall short in building resilience at local level, whereas considering the perspectives and experiences of community members offers greater degree of success in achieving the targets [22]. Scorecard approaches are fundamentally participatory, involving different representatives of population to assess resilience [23].
Disaster resilience assessment studies usually focus on evaluating the ability, preparedness, resource availability, and willingness of a community to prepare for and invest in DRR efforts. The assessment can be made for a specific sector or by considering the multiple sectors at once. This is being done by selecting certain indicators and assessing their status in context of hazard susceptibilities, vulnerabilities, exposures and disaster risk. Though, the choice of indicators even for studies of similar nature remains usually variable if not completely different. Different studies have used different approaches, diverse indicators, and variable measurement and spatial scales for the resilience assessment. For example, a study carried out for Italy adopted Comprehensive Disaster Resilience Index to assess resilience at municipal level [24]. Another assessment used 86 indicators under six resilience dimensions i.e., physical, health, economic, environmental, social and governance to measure community resilience at local level [25]. Scaling patterns of urban resilience are also being used to assess the relationship between various resilience indicators and size of urban population [26]. While some investigations applied single perspective such as gender to assess the disaster resilience [27], others presented a comprehensive evaluation framework, identifying economy, society, environment, nature, and governance as different dimensions of urban resilience [28].
Srinagar city’s inclusive or sector-specific resilience has not been assessed. Here in this assessment, we adopt a scorecard approach using a template from United Nations Office for Disaster Risk Reduction (UNDRR) to assess the resilience of the city. The primary aim of this study is to evaluate the urban system and its components from the resilience perspective. The study also aims to put a spotlight on sectors and their components that need attention of government institutions and other stakeholders, and convincing them for initiating focused disaster risk reduction (DRR) and resilience building measures in the city.
Study Area
With an area of about 300 km2 and a population size of 1.7 million (Fig. 1), Srinagar city is the largest urban center in the northwest Himalaya (India). Witnessing an average annual growth of 2.50 percent from 2006 to 2020, the city has also been listed in 100 fastest growing cities of the world (http://www.citymayors.com). The city is being developed as one of the100 smart cities in India—a project launched by Ministry of Urban Development in 2015, that aims to enhance the efficiency of services, work towards sustainability and improve the quality of life of the resident population.
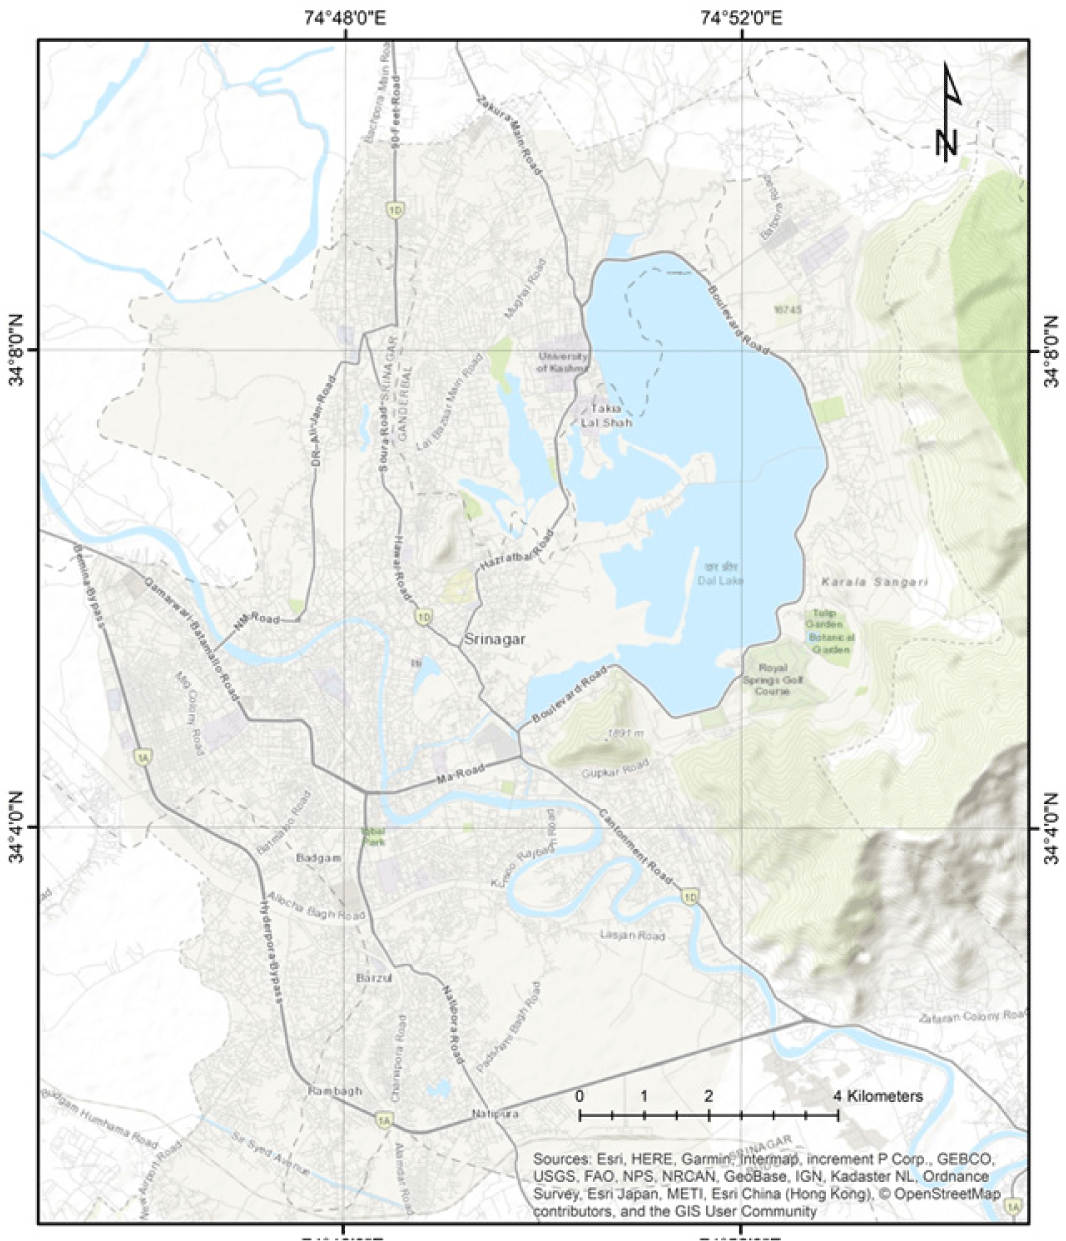
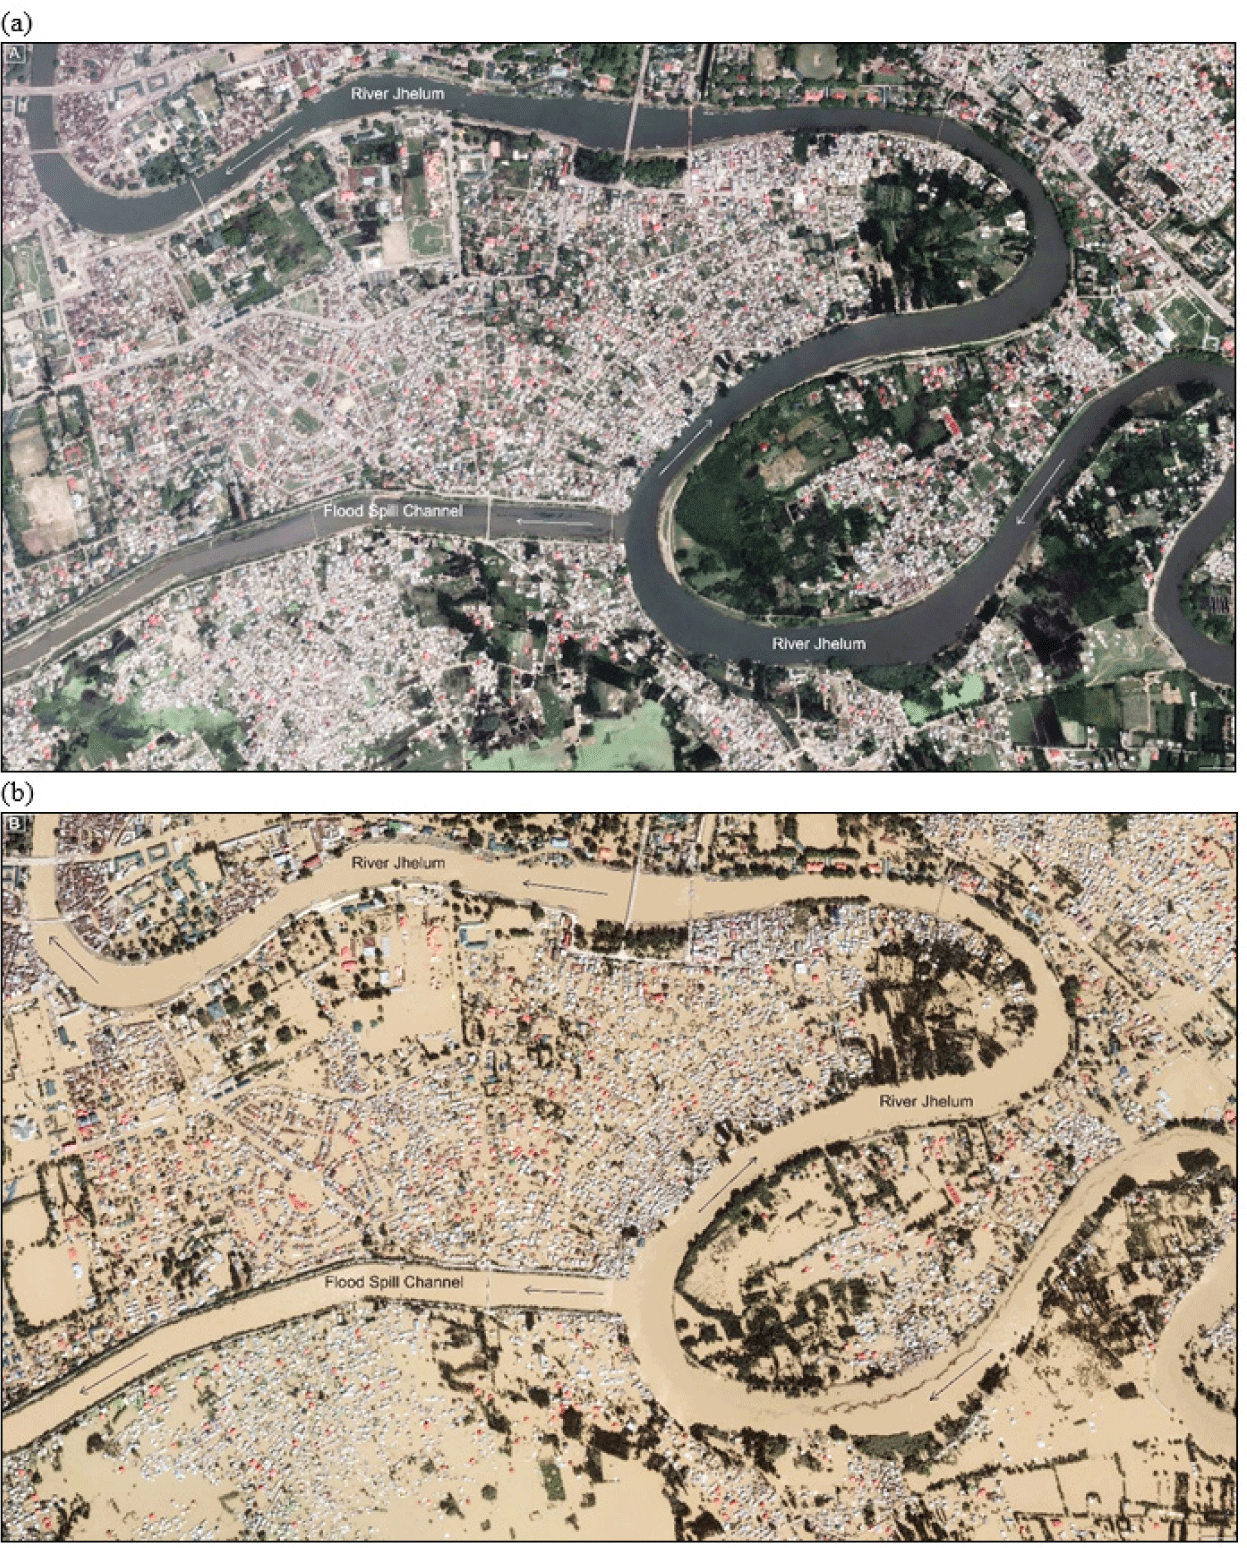
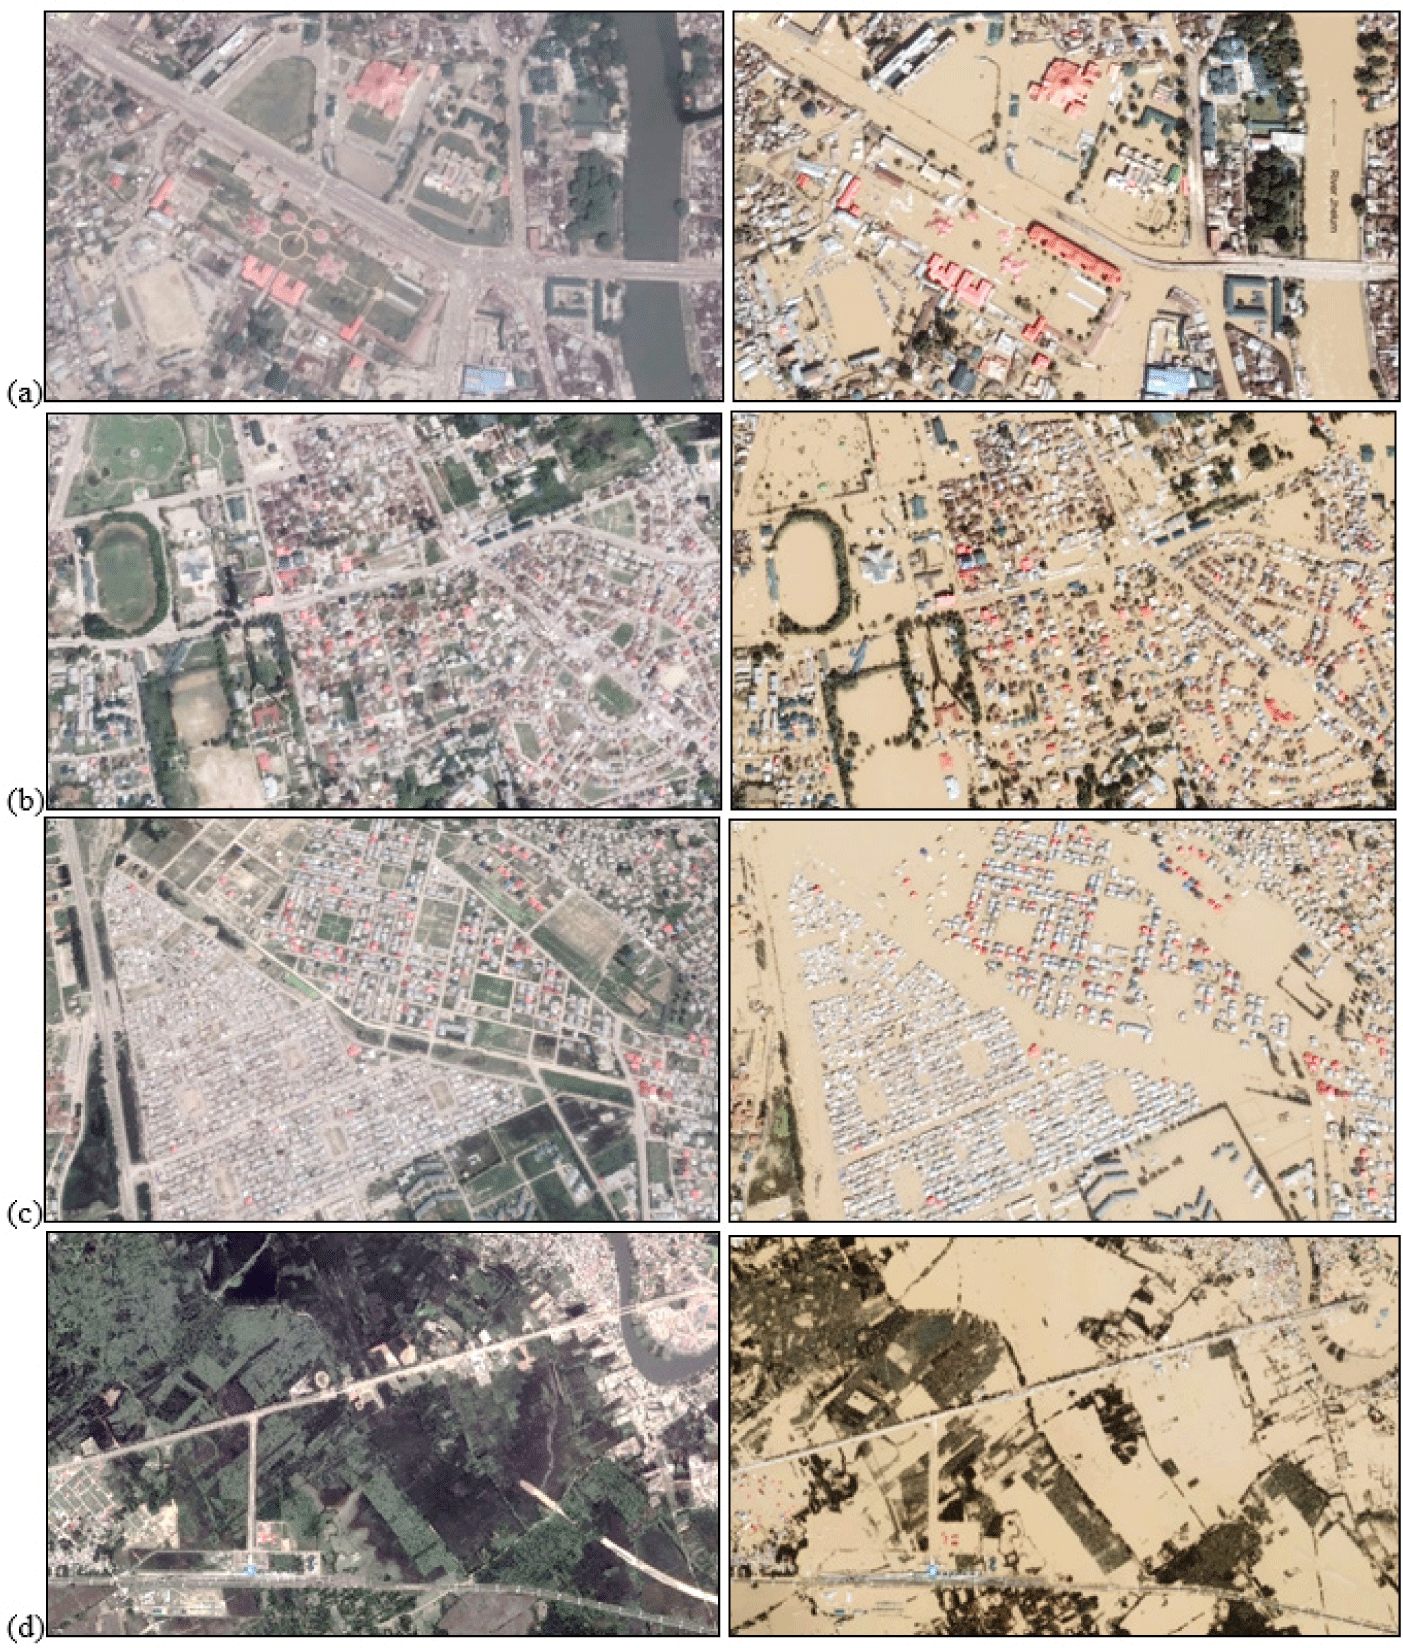
Srinagar city is exposed to a range of natural hazards especially floods, earthquakes and extreme weather. In addition to being socioeconomically vulnerable, the city has been the center of regional conflict [29], making it susceptible to exacerbated impacts from environmental shocks. Spatially, the city has evolved along the banks of River Jhelum— the trunk river of the Kashmir Basin (Fig. 1). As a result, the city is frequently impacted by floods [30–32]. In the recent decades (e.g., 1990–2020), the growth of human settlements has been massive in the city, mostly taking place at the cost of agriculture land and sensitive ecosystems such as wetlands [33–35]. Moreover, because of missing risk-sensitive land use planning, the expansion of residential and commercial establishments has been rampant in the low-lying parts of the floodplain, which remains an ideal recipe for flood disasters. In 2014 about 60% of the city was directly impacted by extreme flooding (Figs. 2 and 3), witnessing a flood water depth of more than 16 feet in the Central Business District, affecting whole population directly or indirectly and resulting in complete breakdown of city’s utilities and functioning of the critical infrastructure for about a month [36].
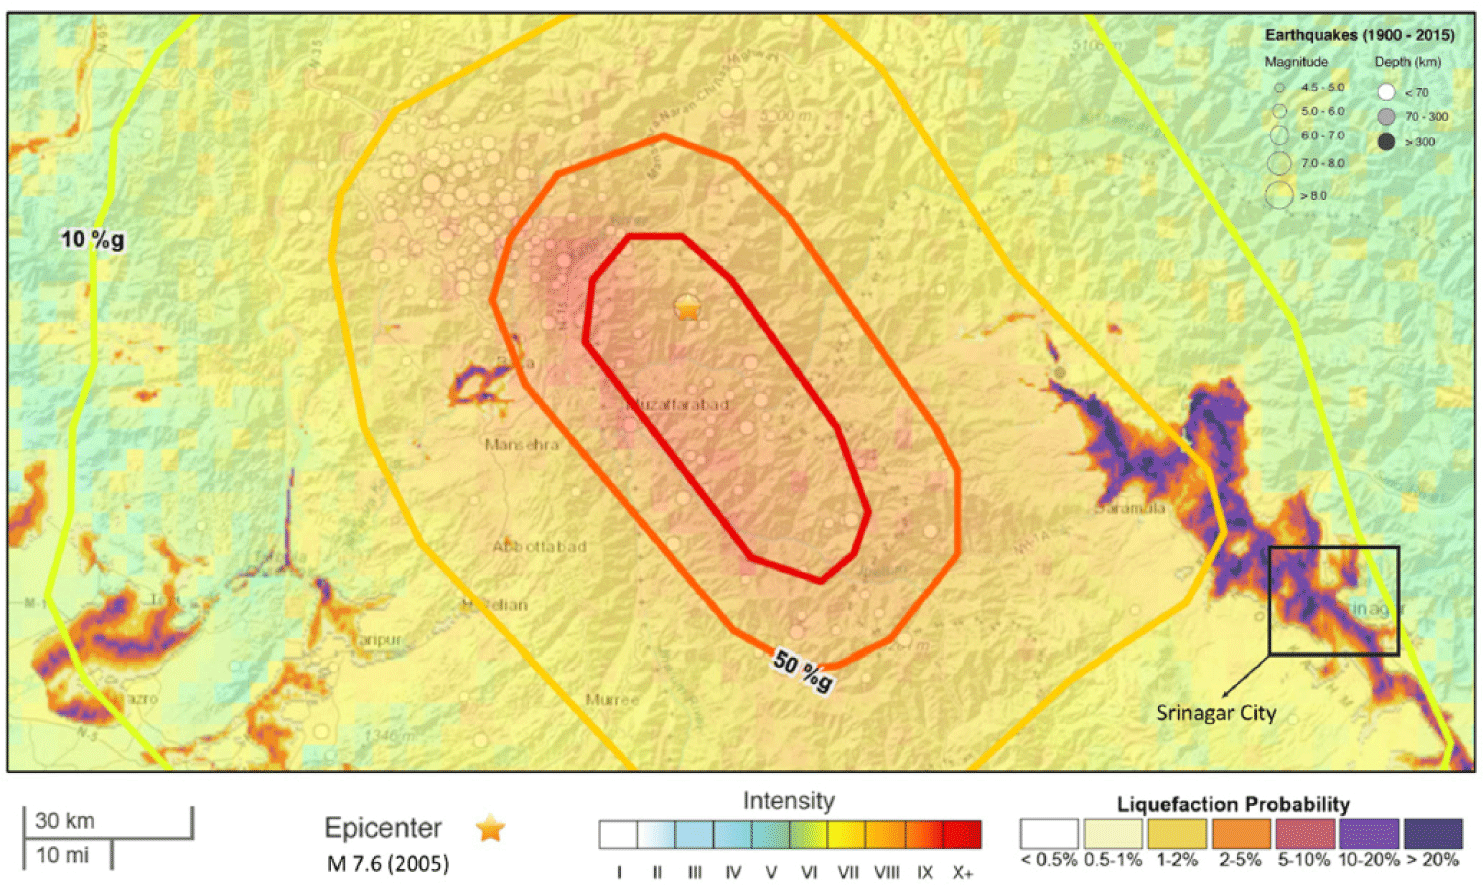
The city has also been subject to devastating effects of seismicity e.g., during the earthquake of 1,885 [37]. Although the city falls in the Seismic Zone V—a very high risk zone, which can experience a shaking of IX intensity (MSK) and the memories of the devastation caused by the M 7.6 earthquake (2005) in the neighborhood are still fresh (Fig. 4), people in general and government agencies are not paying desired attention to implementation of building codes and land use planning; and the built-up continues to evolve on the soils with high liquefaction potential (see inset of Fig. 4). Moreover, under the influence of changing climate, weather extremes have become frequent and intense [38–40]. Hence, improving the understanding about the city’s resilience to manage these evolving challenges has become necessary.
Methodology
This study applies a resilience scorecard (Detailed Level Assessment) developed by the UNDRR [41] to gauge the resilience of Srinagar city. The assessment will enable measurement of the current state of disaster resilience, enhance understanding of resilience challenges, allow identification of priorities for investment and eventually lead to actions, enhancing resilience of the selected city [42]. Resilience scorecard seeks answers to questions, concerning preparation, response and recovery efforts of DRR and resilience building process [12]. The scorecard approach is advantageous because the voices raised by the responders are generally convincing for local planners and governments to set priorities, allocate funds, and develop emergency plans [42].
The scorecard used here covers 117 indicators under 10 resilience elements, including: 1. Organize for resilience, 2. Identify, understand and use current and future risk scenarios, 3. Strengthen financial capacity for resilience, 4. Pursue resilient urban development, 5. Safeguard natural buffers to enhance the protective functions offered by natural ecosystems, 6. Strengthen institutional capacity for resilience, 7. Understand and strengthen societal capacity for resilience, 8. Increase infrastructure resilience, 9. Ensure effective disaster response, and 10. Expedite recovery and build back better; see supplementary material, Supplementary Table S1 to Table S10 for the details. The template is exhaustive and covers almost all the essential dimensions, reflective of city’s level of resilience, including features of coping, adapting, and transforming mechanism (Fig. 5).
The study was conducted through a participatory approach and collected record of judgments on the selected parameters from 300 respondents representing different professions, age groups, and genders to derive inferences about the resilience of Srinagar city. The discussions were conducted in groups, comprising 5–15 persons for a period of three months. The format allows response of six levels (0–5) to each question, where 0 corresponds to minimum and 5 maximum score of resilience. Although the scorecard is methodical, the scores given by the respondents are based on their personal judgment that matches closely to the level of resilience [42]. Mean of the responses was taken as the final representative level for a particular feature or question and the resilience score derived through the assessment was used as an indicator of the level of resilience.
The sample size was calculated using Yamane’s formula [43], applying a 0.05 margin of error, corresponding to a 95% confidence level or a 6% level of significance. This level ensures that the sample yields sufficiently accurate and unbiased estimates of population. To enhance the representativeness of the population, a simple random sampling technique was employed, ensuring that individuals from various dispersed locations within the study area had an equal chance of being selected. This method minimizes sampling bias, as randomization inherently supports the generation of unbiased estimates of population characteristics. The formula used here, involves normalization for determining an appropriate sample size and was used in the context, given below.
Where, n is the sample size to be determined, N is the population size of sampling units, and e is the margin of error.
The individual responses of the residents were recorded using a predetermined 6-point measurement scale, which offered six distinct options ranging from 0, indicating the lowest score, to 5, indicating the highest score on the scale. This scale generally consisted of a statement or question followed by a set of response choices that captured varying levels of opinion regarding a specific parameter. As a psychometric tool, the scale is unidirectional or linear. Each respondent was requested to choose one option from the six available, based on their knowledge and understanding. The participants selected their responses to the best of their expertise, and these psychometric responses were subsequently recorded in the questionnaire. The recorded responses were then subject to averaging to provide a representative value for each question during the final analysis. Where, applicable, decimal values resulting from the mean were rounded to the nearest whole number. The average responses of the residents concerning all 117 parameters were calculated using the following procedure.
Where, AS is the average score, NOi is the number of respondents marked a particular option i for a given question, n is the number of options of a given question, i.e., 6 for the current study, and N is the number of respondents, i.e., 300 or the sample size. The zero in the options of the questions has a specific meaning; therefore, the range in the formula will vary from 1 to 6, which otherwise would be eliminated on multiplication.
Results and Discussion
This element of the scorecard comprises nine questions under four domains: plan making; organization coordination and participation; integration; data capture, publication and sharing. Here the template focuses on scientific assessment of risk in plan making process. It also evaluates nature, magnitude and spatial patterns of urban growth and future planning. Moreover, it assesses the involvement of stakeholders in plan making and regular review of strategic plans, Supplementary Table S1.
State Disaster Management Authority (SDMA) and Department of Disaster Management, Relief, Rehabilitation & Reconstruction are the main institutes for DRR activities at the regional level. In addition, there are three agencies at city level i.e., Srinagar Development Authority (SDA), Srinagar Municipal Corporation (SMC), and Town Planning Organization that have direct and indirect roles in resilience building; each of these agencies have their own development plans for the city. One of the key issues identified by the respondents in this element was missing DRR plan at the city level. Moreover, the respondents in general opined that risk assessments are not made at all. Participants also pointed to lack of institutional coordination as one of reasons behind ineffective development projects. For example, they noted that conflicts in planning are often seen between the road network development and utility service projects primarily because of overlapping or mismatching work calendars, causing disruption in transportation, delays in project completions and immense monetary losses to both public and private sectors.
There is some level of consultation with people about certain development plans; however, respondents were not satisfied with the degree of consultation. They believe that consultation is being done occasionally and it is not a regular practice (Fig. 6a). The pre-event planning and preparation is usually being done at the last moment and is restricted to particular situations such as clearing snow from roads during winter months and deployment of men and material to locations struck by hazards. Moreover, detailed resilience assessments are not being carried out and results if at all compiled do reach the stakeholders. Further details on score in this domain are depicted in Fig. 6a.
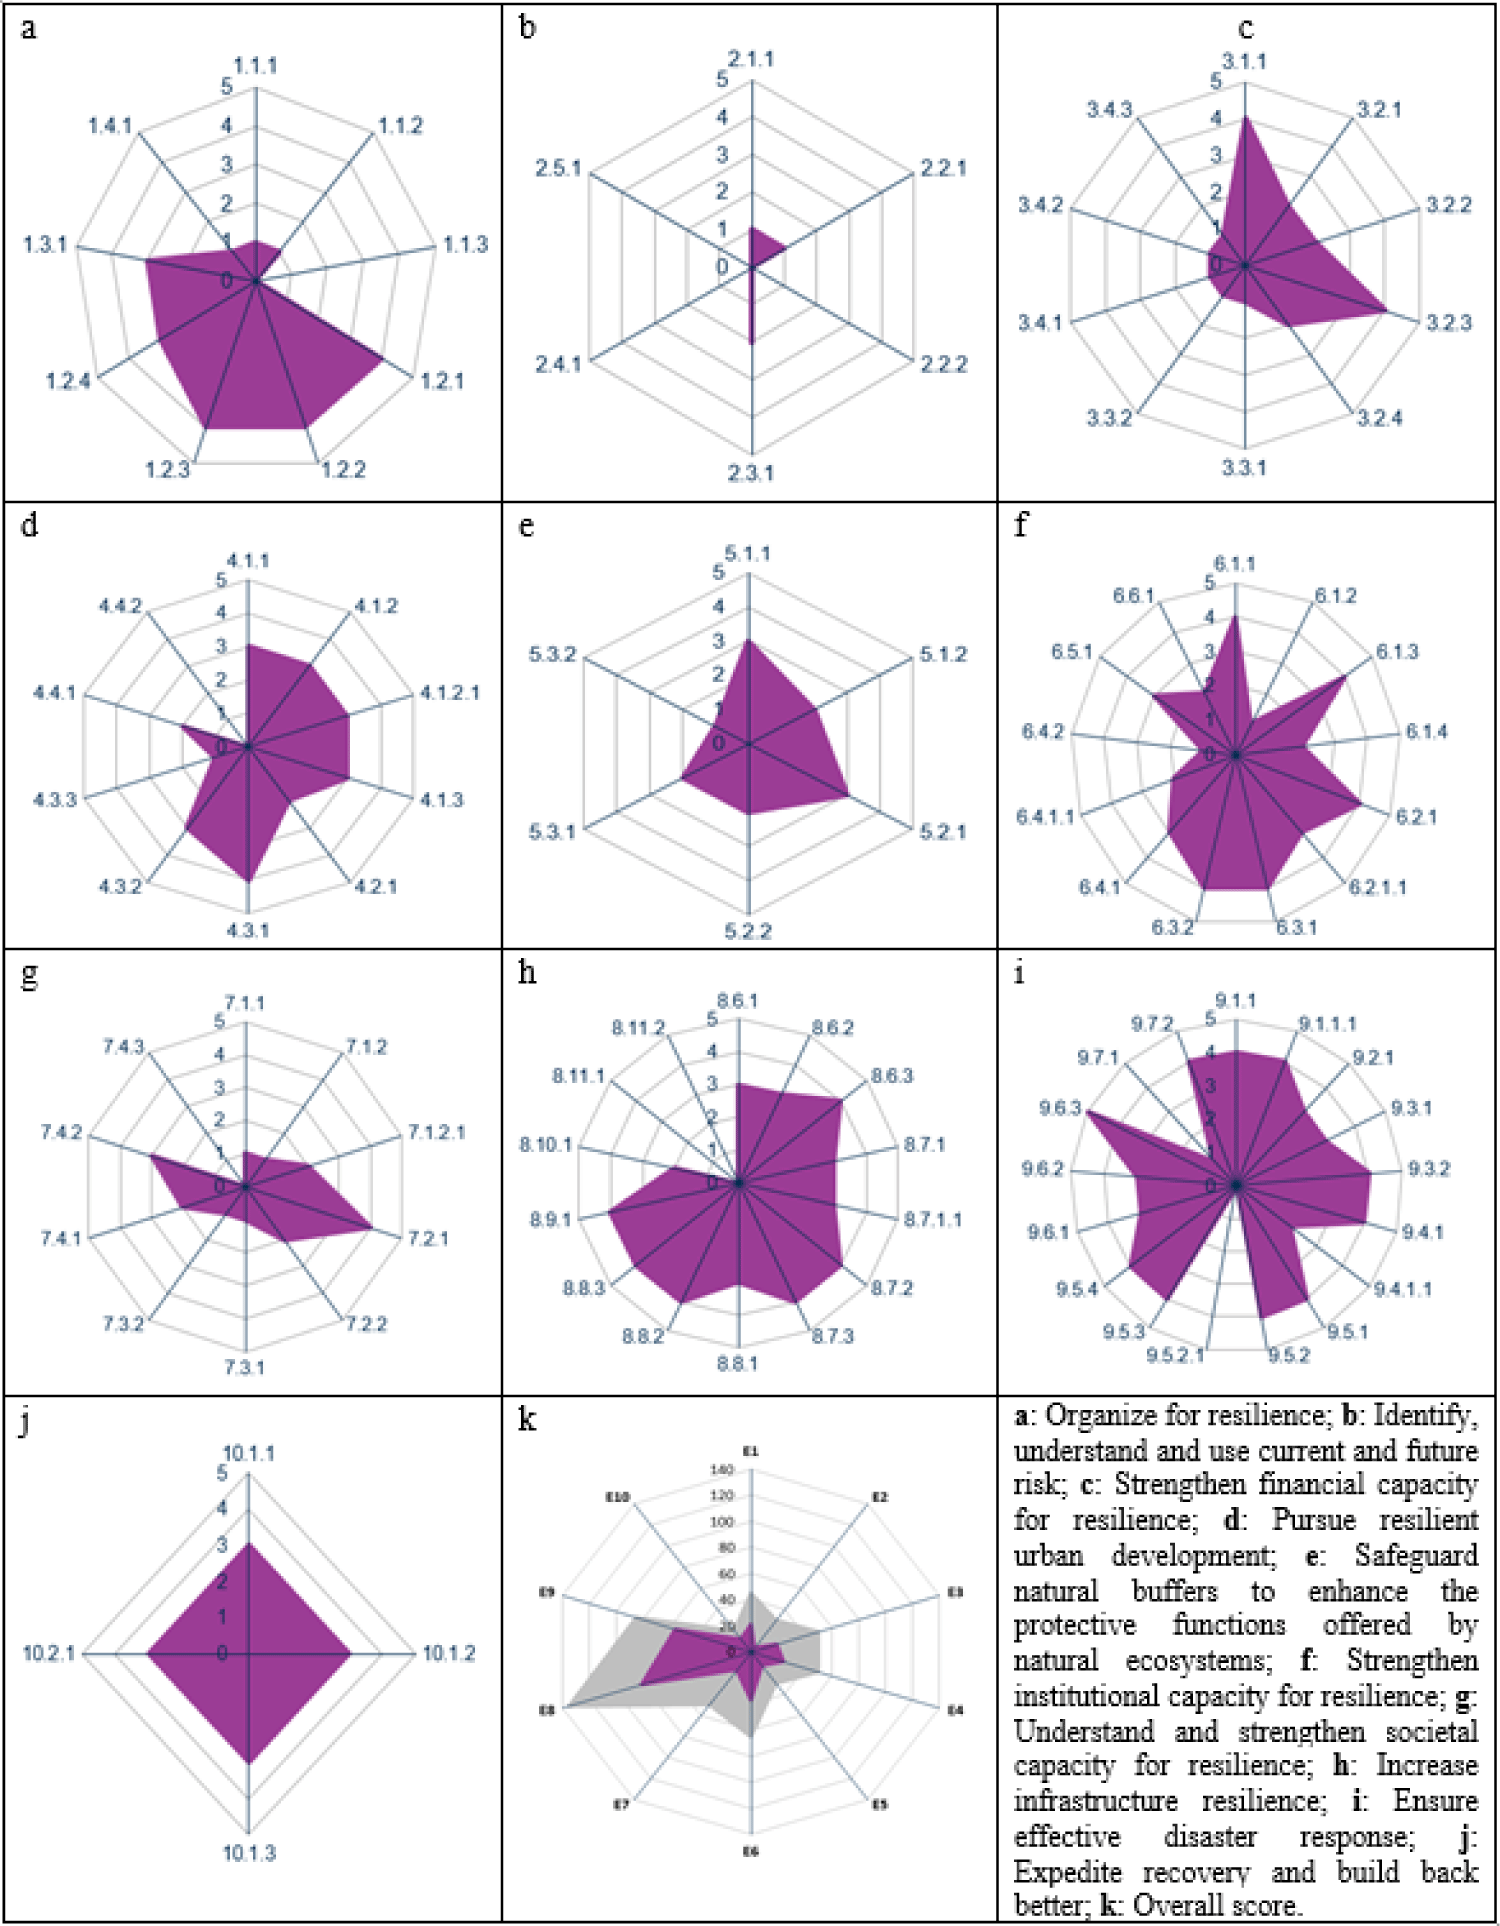
In order involve all the participants and guide to them in rational decision making, theoretical background of the terminology was deliberated. For example, under the variable ‘identify, understand and use current and future risk scenarios’ we had to define it first. So, we defined risk as a function of hazard, exposure and vulnerability [44–46], encompassing analysis of magnitude, spatial distribution, and temporal characteristics of prevailing hazards, spatial distribution of population, critical infrastructure, and other assets in different hazard zones, and assessment of physical, social, economic, political, and environmental vulnerabilities of a community [47,48]. This explanation made it easy for the participants to have their opinion. The respondents believe that this thematic area is one among the frailest and needs specific attention in case of Srinagar city. No reliable and updated disaster risk information or maps of the city are available. Thus, the city scored very low on parameters under this section such as hazard assessment, knowledge of exposure and consequence, cascading impacts, hazard maps, updating of hazard, exposure, and vulnerability information (Supplementary Table S2 and Fig. 6b).
The idea that financial resilience to protect livelihoods and people requires policy actions and financial mechanism [49] was brought to fore for the convenience of participants. The assessors argued that almost all the agencies that govern the functioning of the city have enough understanding of the possible sources of funding and they actively pursue financing as required. Generally, they were also of the opinion that operating costs of disaster resilience activities are adequate; however, according them, the financial planning for all the actions necessary for disaster resilience and contingency funds are not. Domestic and non-domestic insurance coverage is minimal as per their assessment. Similarly, participants think that incentives and financing for business, community organization and citizens has not been enough and accessible, consequently financial resilience efforts have been ineffective in reaching desired targets (Supplementary Table S3 and Fig. 6c).
Here we reminded the participants that rapid urbanization is among the major challenges for land and people, causing severe ecological, economic, and social problems, especially in developing countries [50]. As moderators, we also highlighted that building resilience provides a systematic framework for reducing urban disaster risks [8]. The attributes covered in this thematic area include questions of land use zoning, new urban development, building codes and standards, and their application (Supplementary Table S4). According to template, the zoning implies the percentage of population with risk of displacement under most probable hazard scenario. It also signifies the percentage of economic activities and agriculture under risk. For all the sectors, the percentage likely to get affected in ‘most probable’ scenario is <2.5% according to participants. Other features considered here include innovation for sustainable urban development and implementation of building codes; the participants argued that the former is negligible and the later almost missing. See Fig. 6d for further details.
Natural ecosystems contribute considerably in building the urban resilience [51], is an example of statements made by moderators to initiate the discussion on the theme here. It also involved discussion on how risk-informed decision-making in cities necessitates understanding of the natural environment and ecosystem health. Srinagar city has immense green and blue infrastructure, especially in the form of freshwater wetlands. The respondents reverberated that even if the community and the institutions are largely aware of the ecosystem services, the monitoring and management is not happening on a required level, consequently ecosystem health is generally not maintained well. Almost all the groups agreed that the wetlands are deteriorating in and around the city, primarily owing to lack of conservation and restoration efforts. Similar reporting has also been made by many empirical studies on wetlands dynamics in the study area [33–35]. It has also been noted that, land use policy of the city is supportive of critical ecosystem services and health, but it is not fully enforced. Likewise, the green and blue infrastructure is routinely embedded in new development projects but their long-term monitoring is not satisfactory. Moreover, transboundary environmental issues are not identified and addressed in the city planning; see Supplementary Table S5 and Fig. 6e for the resilience score under this domain.
Institutions play a critical role in implementing disaster resilience framework [52], and this understanding was clearly contemplated by the participants. This section of the template assesses the availability of skills and experience and private sector links to achieve maximum disaster resilience. Moreover, it covers engagement of the insurance sector, civil society links, public education, data capture, publication and sharing (Supplementary Table S6). Opinion of participants was that the attributes related to the availability of skills and experience and engagement of the insurance sector perform adequately well; however, some attributes such as private sector links and civil society links scored low in their rating (Fig. 6f). Exposure of public to education and awareness materials through diverse media channels is satisfactory. Although not completely and not in a precise manner, city’s capacity is shared with other organization involved with specific resilience work. Training delivery for improving the resilience is usually being done by professional forces like that of State Disaster Response Force (SDRF), Fire Services, and Home Guards and academic institutions especially universities. Language is not a barrier to disseminate information and education, and training is accessible to most of the city’s inhabitants.
Here the theme includes features like community organizations and cohesion, business continuity planning, community engagement and education (Supplementary Table S7). Overall, the opinion of participants was that community or grassroots organization are mostly local faith-based groups which do not specifically focus on disaster risk management and their network is restricted to off-the-cuff meetings. These groups are often short of skills and resources; as a result, they contribute insignificantly to resilience building of the community. The community is socially connected but there is minimum or no effective engagement with vulnerable groups. The private sector is not an organized one and communicating resilience issues to employees or workforce is usually not being done. Business continuity planning is not considered seriously before crisis; disasters (e.g., 2014 flood) often cause agonizing livelihood losses and complete collapse of business. Moreover, the participant were of the opinion that citizen engagement techniques and frequency are weak. With regard to information dissemination, participants agree that citizens do receive updates and warnings mostly on radio, TV and social media about the predictable hazards. Moreover, there is some knowledge among the population about the most probable risk scenario and the responses thereof, mainly because of the experiences during past events especially from floods; but no poll or validation has been done for this purpose. Further details of score for different components in this domain as perceived by respondents are shown in Fig. 6g.
Under this element discussions revolved around the role of resilient infrastructure in bouncing back and restoring critical services quickly after a disastrous event [53]. Most focus groups believed that protective infrastructure of the city does provide some degree of safety from ‘most probable’ scenario; however, becomes ineffective in ‘most severe’ episodes, as was observed in 2014 flood event. The impact of this flood was exacerbated by the failure of key infrastructure sectors, including healthcare, education, communication, transportation, energy, water and food supply, banking, sanitation, and emergency services. In general, city’s critical infrastructure is not resilient and often fails due to shocks, as argued by most respondents, Supplementary Table S8. For example, power supply is often disrupted by small weather events like winds, rainfall, and snowfall, revealing fragility of the electricity infrastructure including grids, transformers, and transmission lines. Similarly, road connectivity is lost frequently, especially along mountainous tracks as a result of weather disturbances. Furthermore, the maintenance of protective infrastructure is not a routine process and is usually being done in response to incidents reported by people. Past experiences reveal that poor maintenance of the critical infrastructure leads to frequent disruption of essential services. Consequently, some loss of critical services even under a ‘most probable’ scenarios is always a possibility; see Fig. 6h.
Effective disaster response includes features like availability of early warning systems, event response plans, trained forces, equipment, and shelters (Supplementary Table S9). A basic early warning system does exist for the city and the effectiveness and reach of the system is also satisfactory. Responder, suggest that the systems are able to issue warnings and disseminate the information through electronic media in a timely manner. However, event response plans are of general nature and lacking detailed operation procedures in most cases. The professional staff is adequate in number, having ability to reach all neighbourhoods within 4–12 hours; however, certain level of shortfall in equipment and supply needs is often felt. In worst case scenarios, as observed during 2014 flood, acute shortage of food, shelter, and fuel supply is witnessed. The ability to meet the needs within a given timeframe would largely depend on stockpiling and road connectivity to other parts of the country. Interoperability, emergency operations centers, coordination of post event recovery, and effectiveness of drills and training are the aspects, where the city scores relatively better (Fig. 6i).
This thematic area covers post event recovery and economic reboot, processing incoming aid, disbursing funds, and learning loops (Supplementary Table S10). Most participants argued that post-event recovery planning does exist for most probable scenarios and some degree of consultation takes place with stakeholders in the city and such plans are usually developed in response to events. However, the financial supplements are meager and do not contribute much in alleviating sufferings of the residents after disasters. Moreover, people often do not take lessons from past experiences; as a result, with continuing bad practices (e.g., not conforming to building codes and hazard zoning), risks keep on accumulating and disasters looming (Fig. 6j).
Based on the evaluation of respondents, including an assessment by the authors, Srinagar city received an overall score of 284 out of 560 (Fig. 6k), indicating a clear resilience deficit. The elements where the city exhibited the lowest resilience include E2, E5, and E7; whereas, E1, E3, E4, and E10 are the elements in which resilience levels of the city are intermediate; and E6, E8, and E9 are the elements where the city scores relatively highest as perceived by the respondents. However, none of the elements revealed a resilience level enough to absorb and effectively respond to shocks. Although interventions for improving resilience are required in all the domains assessed in this study, the elements that scored relatively low should be addressed on priority. For example, the element E2, which focuses on ‘current and future risk scenarios,’ scored lowest in the present study. Having a complete knowledge of spatial and temporal trends of risk is a starting point for working in the direction of resilience building and risk-informed governance of the urban areas. In the absence of risk information, building resilience of the city is almost impossible. It is because of lack of risk-information, the development projects initiated by different institutions in the city are not in line with the resilience building targets identified in various global initiatives such as Sendai Framework for DRR (2015–2030), Sustainable Development Goals (2015–2030) and Urban Climate Action Programme (UCAP). Even small development projects, where risk information is lacking, are often questioned by the people for not being well-thought-out or satisfactory.
Conclusion
DRR efforts are largely response-centric in Srinagar city. In order to bring attention of policymakers towards frail components of the urban system, it is essential to understand their levels of resilience. This process guides policy makers in building the resilience of different sectors and adopting a proactive approach in DRR. The perspectives of community members may provide valuable insights in resilience assessment process; however, their opinion is rarely recorded or considered by policy makers and relevant government agencies. As a result, DRR initiatives often fail to deliver desired results. The participatory approach adopted in the present study provided an idea about the level of resilience in different sectors and how resilience is being perceived by local experts and people. The assessment also demonstrated the differences in resilience, exhibited by various components within a particular sector. The opinion of the participants presented a wider perspective of the city’s resilience and the results can provide vital inputs to local authorities for resilience building plans and targeting critical areas at various levels across the sectors in the city. The unraveling of weaknesses and strengths would also help in linking the resilience building efforts with existing development projects. Overall, this resilience assessment is expected to have a positive impact on policy formulation, risk-informed governance, and DRR in Srinagar city. Moreover, the study construes that the resilience assessment template used here is an excellent tool for identifying the factors that demand attention, which otherwise are difficult to capture in unidimensional case studies. Furthermore, the tool offers an opportunity for cities with limited resources to make resilience assessment efficiently.